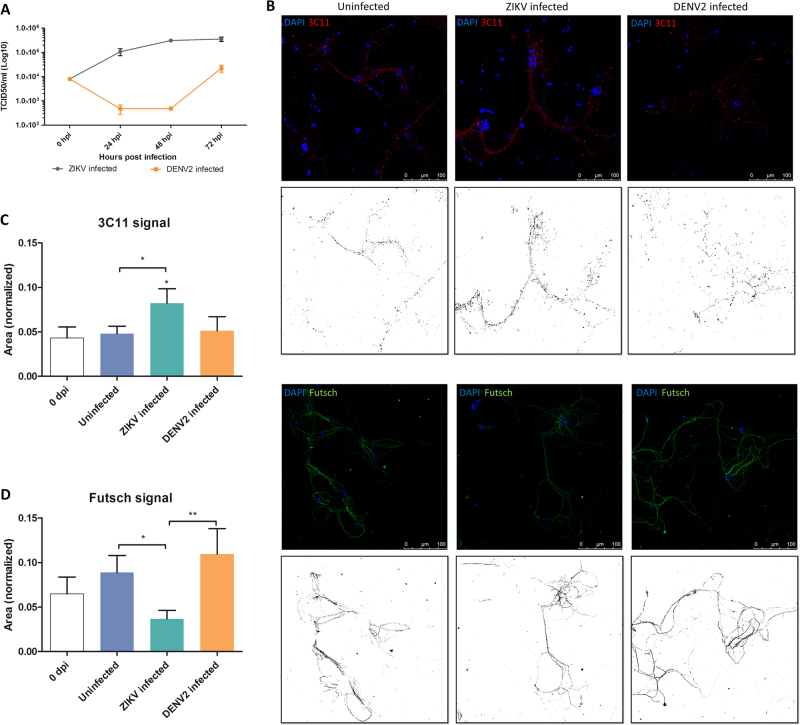
Fig. 3. Effect on neuronal network after Zika virus (ZIKV) and Dengue serotype-2 virus (DENV2) infection in primary neuron cultures.
a ZIKV replication dynamics (using TCID50 in Vero cells) in primary neurons from mosquito primary neuron cultures (n = 3 per condition). b Confocal images of mosquito primary neuron culture post ZIKV and DENV2 infection at 7 dpi. In red is 3C11 antibody, corresponds to Synapsin-1, and in green is Futsch antibody, a MAP1B homolog. Each confocal image has its respective image showing stained signal after applying image threshold with ImageJ. Quantification of 3C11 signal (c) and Futsch puncta (d) in mosquito neuron cultures, normalized by the number of DAPI counts. Statistical differences were calculated with Mann–Whitney U tests by comparing 0 dpi to the other groups unless indicated by bracket. *P < 0.05; **P < 0.01; ***P < 0.001; means ± SEM. For (c) and (d), n values are detailed in Supplementary Table S4

