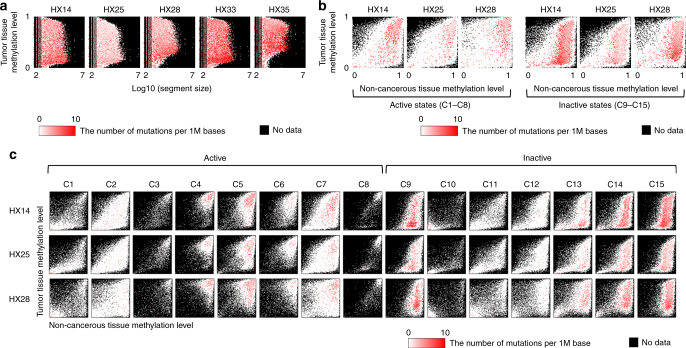
Fig. 2.
Density of mutations in the different epigenetic states in hepatocellular carcinoma. a The distribution difference of somatic mutations that depending on the differences in size (x-axis) and tumor methylation level (y-axis) of the region delimited by 15 epigenomic segments. Red indicates the number of mutations per million bases calculated for each fraction of the images in Supplementary Fig. 5a, which were divided into 100 × 100 areas. b Comparison of the distribution of somatic mutations between the active or inactive chromatin status. The x-axis indicates the methylation level of the non-cancerous liver genome and the y-axis indicates that of the tumor. The accumulation of mutations was higher in hypo-methylated regions in the inactive chromatin. Red indicates the number of mutations per million bases calculated for each fraction of the images of the lower panel of Fig. 1a, which were divided into 100 × 100 areas. c Density of mutations in the 15 epigenomic segments. Red indicates the number of mutations per million bases calculated for each fraction of the images of Fig. 1b, which were divided into 100 × 100 areas

