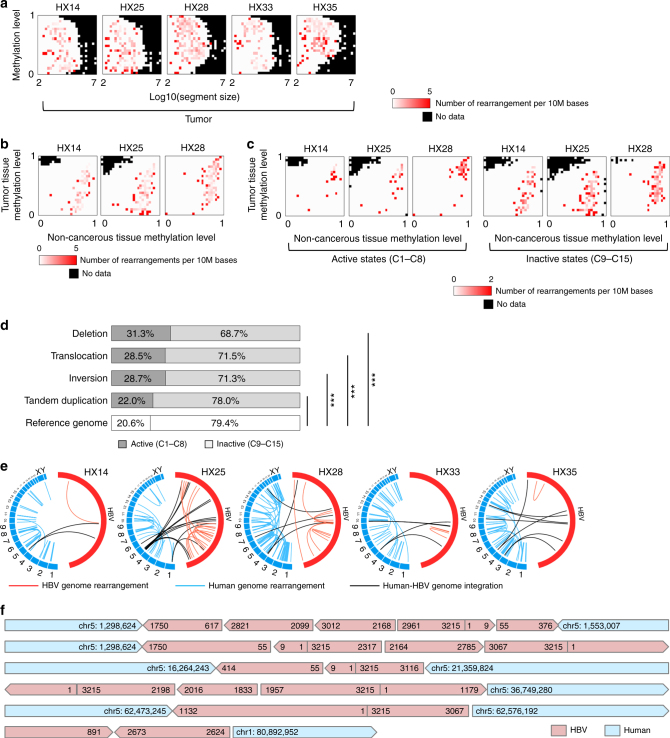
Fig. 6.
Somatic structural alterations of the cancer and integrated virus genomes. a The density of somatic rearrangements in five tumor samples. The color indicates the number of rearrangements per 10 million bases calculated for each fraction of the images in Supplementary Fig. 5a, which were divided into 25 × 25 areas. The x-axis indicates the size of the region and the y-axis indicates the methylation level of the region. All rearrangements in these samples are shown in Supplementary Data 1. b Accumulation of rearrangements according to different methylation levels of tumor (y-axis) and non-cancerous (x-axis) genomes. Red indicates the number of rearrangements per 10 million bases calculated for each fraction of the images in the upper left in Fig. 1a. c Comparison of the accumulation of rearrangements between active and inactive chromatin areas. d The proportion of somatic rearrangements in active and inactive chromatin areas analyzed using whole-genome sequencing (WGS) of 21 HCCs. In the active areas, deletions, translocations, and inversions were significantly enriched compared with those in the inactive areas. *P < 0.05, **P < 0.005, ***P < 0.0005 using the Χ2-test. e Structural rearrangements of the HBV and human genomes in five samples. Red line: HBV internal rearrangement; black: HBV and human genome breakpoint; blue: human genome rearrangement. f Six long reads from PacBio WGS of the HX25 tumor, including the complex rearrangement of viral and human genome sequences. The integrated or rearranged site was validated by at least two short reads obtained by the Illumina platform

