Figure 1.
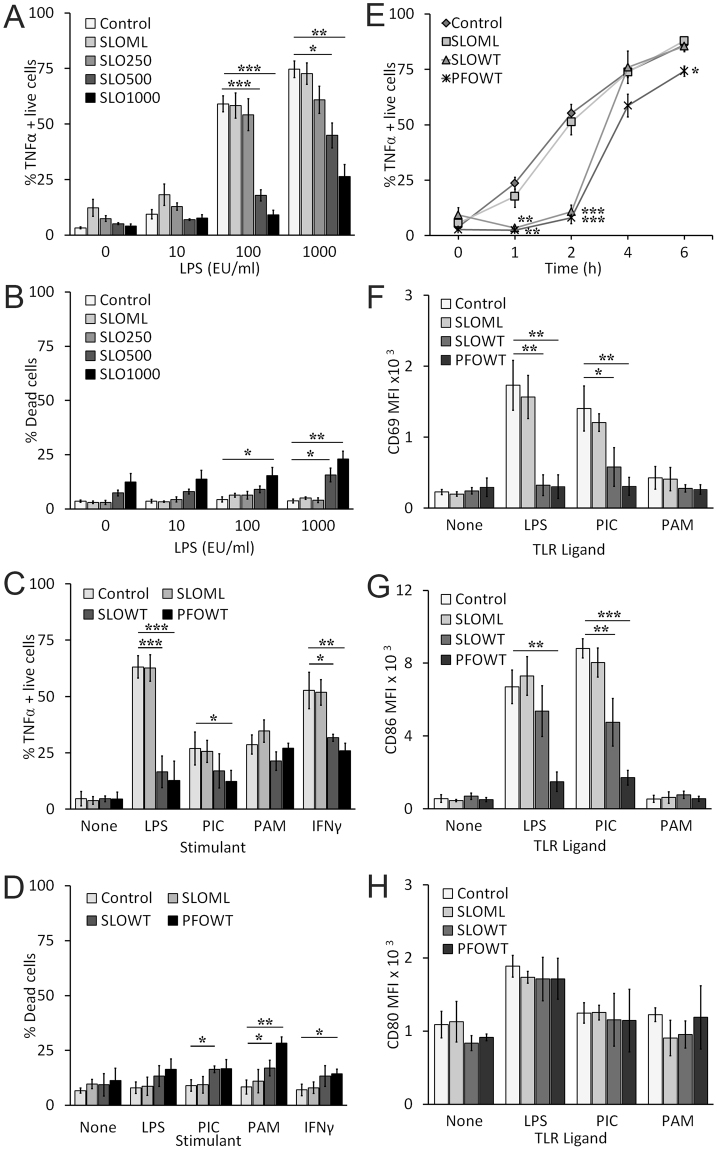
SLO impairs macrophage function. (A,B) BMDM were unchallenged (control) or challenged with 250 HU/mL, 500 HU/mL, 1000 HU/mL SLO WT or a mass of monomer-locked SLO (SLO ML) equivalent to the highest SLO WT dose for 10 min at 37 °C. Toxin was neutralized with serum. Cells were primed with the indicated concentrations of LPS for 2 h. BFA was added 30 min after LPS challenge. Cells were harvested, stained with Ghost Red 780, fixed, permeabilized, stained for intracellular TNFα and analyzed by flow cytometry. The percentage of TNFα positive cells gated on live cells (A) or the percentage of dead cells (B) is shown. (C,D) BMDM were unchallenged (control) or challenged with 500 HU/mL SLO WT, PFO or an equivalent mass amount of SLO ML for 10 min at 37 °C. Toxin was neutralized with serum. Cells were stimulated with no ligand, 100 EU/mL LPS, 10 µg/mL poly I:C (PIC), 1 µg/mL Pam3CSK4 (PAM), or 75 ng/mL IFNγ for 2 h. BFA was added 30 min after ligand challenge. Cells were harvested, stained and analyzed as in (A). The percentage of TNFα positive cells gated on live cells (C) or the percentage of dead cells (D) is shown. (E) BMDM were treated as in (C), except they were all stimulated with 100 EU/mL LPS for the indicated time points. BFA was added 30 min after LPS challenge. Cells were harvested, stained and analyzed as in (A). (F–H) BMDM were treated as in (C), except they were incubated with the indicated TLR ligands for 24 h and no BFA was added. Cells were harvested, stained with Ghost Red, then stained with anti-CD69 FITC (F), anti-CD86 APC (G), and anti-CD80 PE (H) and analyzed by flow cytometry. The mean fluorescence intensity (MFI) of living cells is shown. Graphs represent mean ± sem of at least three independent experiments. ***p < 0.001, **p < 0.01, *p < 0.05.

