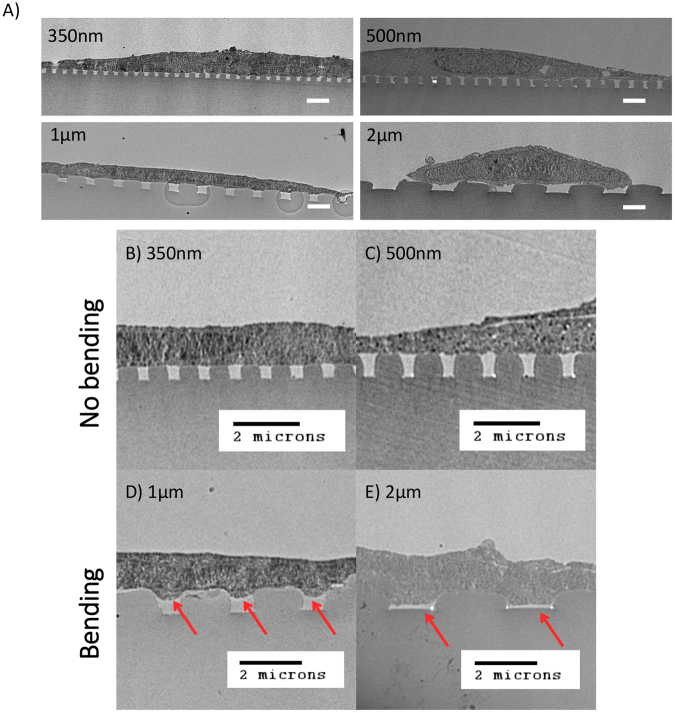
Figure 4.
TEM images showing cross section profile of hMSC basal membrane bending on grating substrate. (A) Whole cell TEM images and (B–D) images zooming in on the cell membrane-substrate grating interface, where gap width of the gratings are as follows: (B) 350 nm, (C) 500 nm, (D) 1 µm and (E) 2 µm. For cells on wider gratings, the basal membrane not only bent deeper into the grooves (red arrow denotes membrane bending into grooves) but also at high frequencies. (Scale bar, 2 µm).

