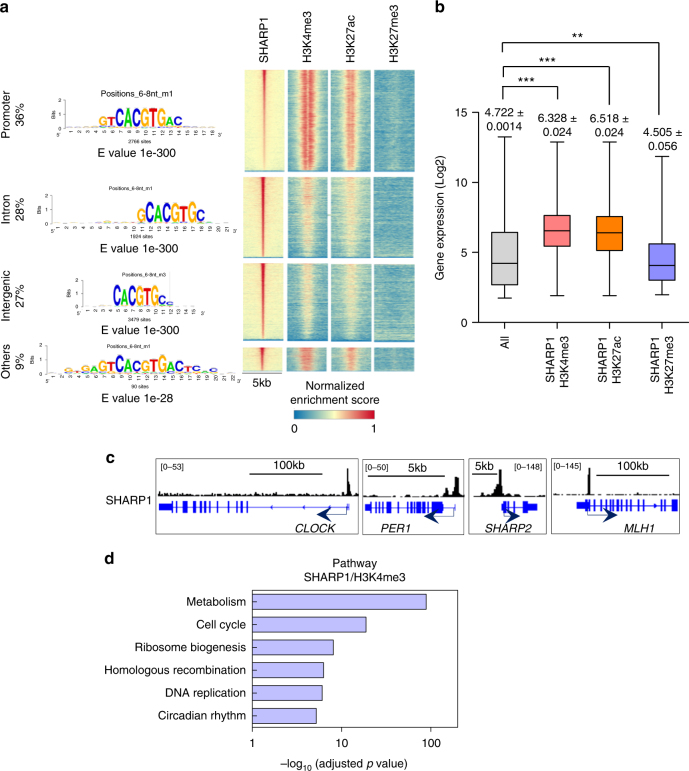
Fig. 6.
SHARP1 binds to actively transcribed genes and positively regulates target genes. a Integrated view of SHARP1 binding sites in conjunction with H3K4me3, H3K27ac, and H3K27me3 profiles across promoters, introns and intergenic regions. Top enriched motifs within SHARP1 ChIP-seq peaks in ML-2 cells are shown according to their genomic location discovered by peak-motifs module from the RSAT suite, using oligomer length ranging from 6 to 8 nucleotides and the 'merge lengths for assembly' option. b Box plot showing the expression levels in microarray analysis of ML-2 cells for the all genes (25293 genes) and genes enriched with SHARP1 + H3K4me3 (6459 genes), SHARP1 + H3K27ac (5840 genes), and SHARP1 + H3K27me3 (1055 genes) identified in ChIP-seq analysis. The box extends from the 25th to 75th percentiles and the whisker extends from the minimum level to the maximum. Median value is plotted in the box. c Representative SHARP1 binding peaks in the known target gene loci (circadian clock genes and MLH1). d Pathway analysis for the genes in the SHARP1 and H3K4me3 co-bounded regions within the promoter and gene body

