Fig. 6.
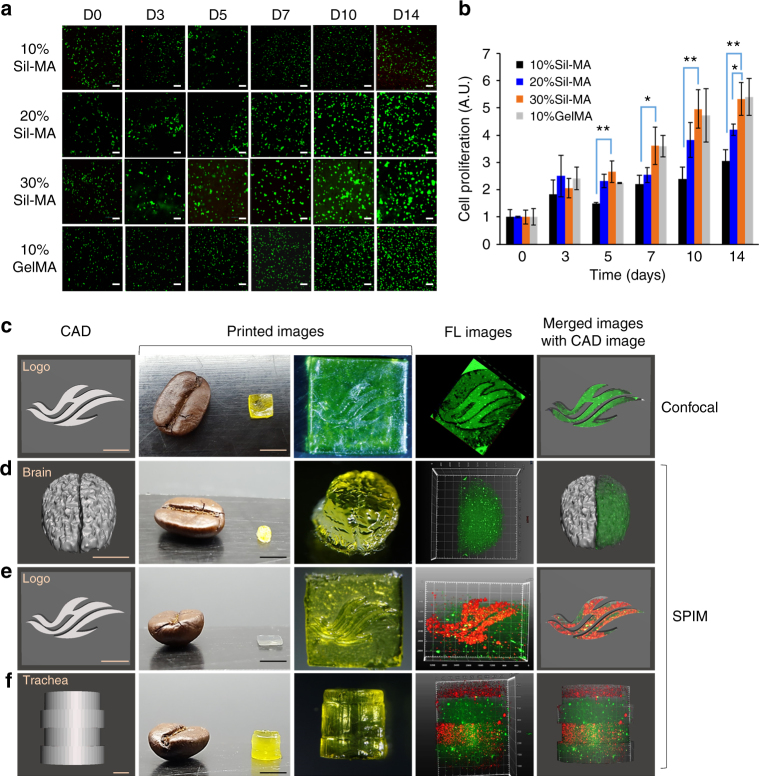
Cytocompatibility of Sil-MA. a Live and dead assay; cell viability of encapsulated NIH/3T3 for 14 days (live cells in green and dead cells in red). Scale bar indicates 500 μm. b CCK-8 assay; cell proliferation in the hydrogel for 14 days. The 30%Sil-MA hydrogel showed the similar cell proliferation to that of commercial GelMA (10%). * and ** refer to statistically significant proliferation p < 0.05 and p < 0.005 (two-sample t-test), respectively, compared to 30%Sil-MA hydrogels. The black line, blue line, orange line, and gray line indicate 10%, 20%, and 30% of Sil-MA hydrogel and 10%GelMA hydrogel, respectively. c–f Cell distribution inside the Sil-MA hydrogel. Cells were distributed evenly in the hydrogels. The Sil-MA hydrogels with c a design of the letter HL (the logo of Hallym University) and d a shape of human brain were printed out with PKH67-labeled cells only. Also, the Sil-MA hydrogels with e the letter HL and f a shape of winding trachea were printed out with PKH67-labeled cells (green) and PKH26-labeled cells (red); (from left to right) CAD images, printed images, fluorescence images by c confocal or d–f single plane illumination microscopy (SPIM) microscope, and merged images of fluorescence and CAD images. Scale bar indicates 1 mm on CAD images and 5 mm on printed images. Data are presented as mean ± s.d. Each assay was conducted in triplicate

