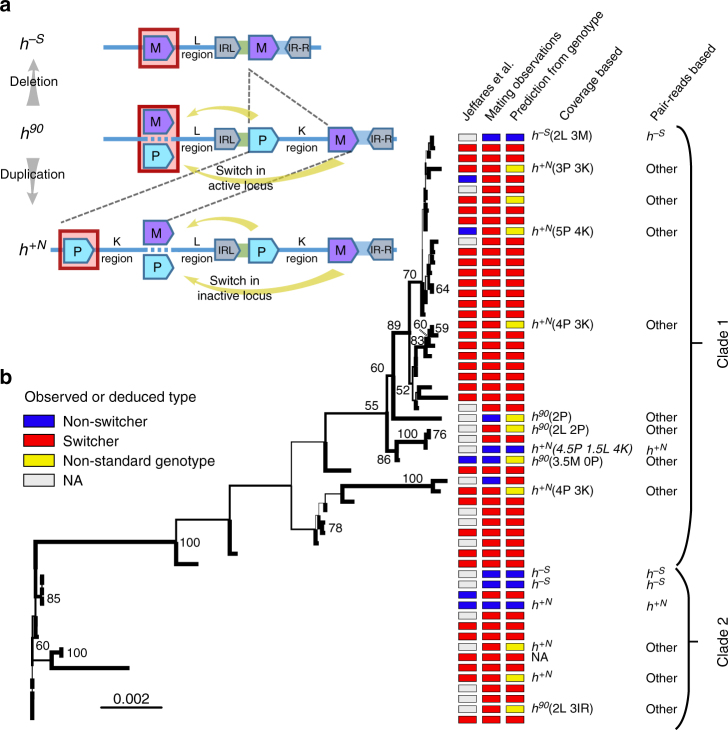
Fig. 1.
The genomic organization of the mating-type region in wild strains and world-wide diversity of switchers and non-switchers. a Schematic of the genetic arrangement for switcher (h90; middle) and the two most common non-switcher phenotypes (h–S and h+N; top and bottom, respectively). Regions are not to scale. The switcher’s active mating-type locus mat1 (red box) switches between Plus (P) and Minus (M), using the silent cassettes as templates during cell division. The non-switcher strain h–S contains only the minus cassette, due to deletion of part of the silent region. The non-switcher strain h+N is the result of a duplication of almost the entire silent mating type and only expresses the P cassette at mat1 (see ref. 9). b The unrooted maximum-likelihood tree for 57 natural fission yeast isolates, based on the L region (results for the 3ʹ and 5ʹ flanking region of entire mating-type region in Supplementary Fig. 3), results in two main clades (indicated by brackets). Branch values show bootstrap support when >50. Colour codes indicate switching phenotypes based on (i) previous observations35, (ii) our test of single-cell colony mating (mating observations) or (iii) the prediction from inferred genotype. Genotypes were predicted based on the coverage and paired-read analyses, as shown in the last two columns (only shown when differing from the h90 haplotype). When genotypes differ from the standard configurations (a), additional information on predicted number of copies for the L- and K-region, and P- and M-cassette (Supplementary Fig. 1) is presented between brackets. The samples that do not fit any existing genotypes in b are labelled as ‘other’

