Fig. 1.
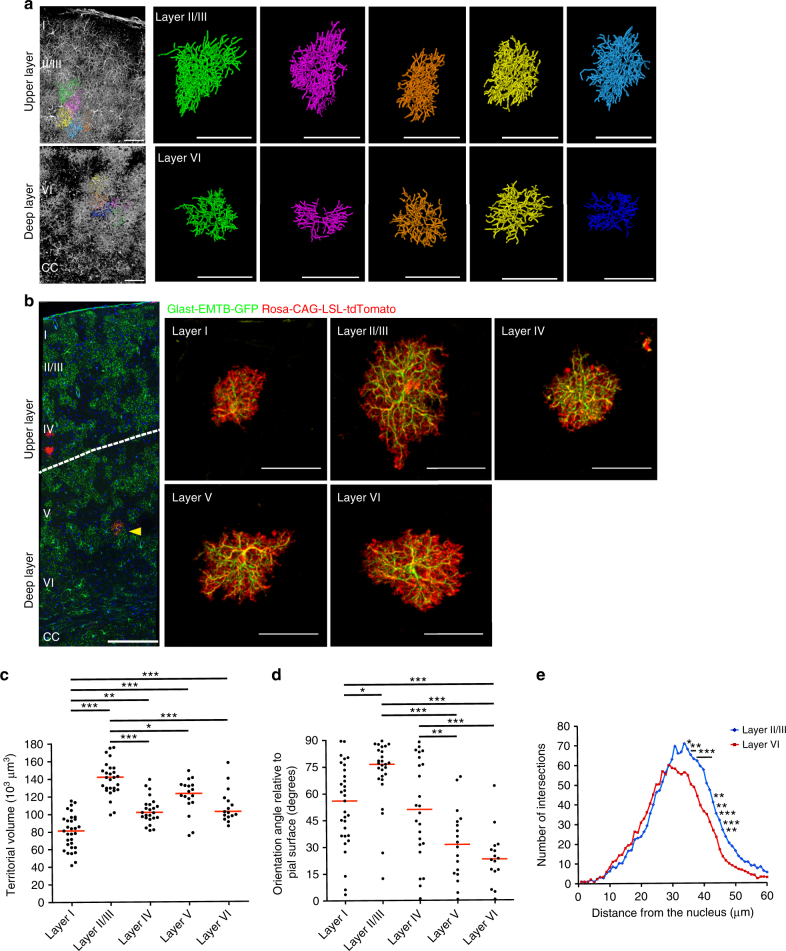
Three-dimensional morphology of astrocytes in layers I–VI of the mouse somatosensory cortex as revealed by visualization of microtubule and whole-cell structures. a 3D reconstruction of astrocyte morphology in the Glast-EMTB-GFP mouse brain (P60) rendered transparent by the CUBIC technique. 3D structures and traces are shown in the left panels, and individual traces in the right. CC, corpus callosum. Scale bars, 250 μm (left panels), 50 μm (right panels). b Representative confocal image of sparsely labeled astrocytes in Glast-EMTB-GFP;Glast-CreERT2;Rosa-CAG-LSL-tdTomato mice (P65) injected with a low dose of tamoxifen at P60 (left), and representative 3D projection images of astrocytes in each layer (right). Arrowhead indicates GFP+tdTomato+ cell. Scale bars, 250 μm (left panel), 50 μm (right panels). c, d Quantification of territorial volume (c) and the angle of orientation relative to the brain surface (d) for astrocytes in each layer. The data are shown for 116 cells from five brains, with the red bars indicating median values. *P < 0.05, **P < 0.01, ***P < 0.001 (one-way ANOVA followed by Bonferroni’s test). e 3D Sholl analysis for microtubule structure of sparsely labeled individual astrocytes in layers II/III and VI of Glast-EMTB-GFP;Glast-CreERT2;Rosa-CAG-LSL-tdTomato mice injected with a low dose of tamoxifen at P60. The data are means (layer II/III astrocytes, n = 27 cells from five brains; layer VI astrocytes, n = 16 cells from five brains). *P < 0.05, **P < 0.01, ***P < 0.001 versus corresponding values for layer VI astrocytes (two-way ANOVA followed by Bonferroni’s test)

