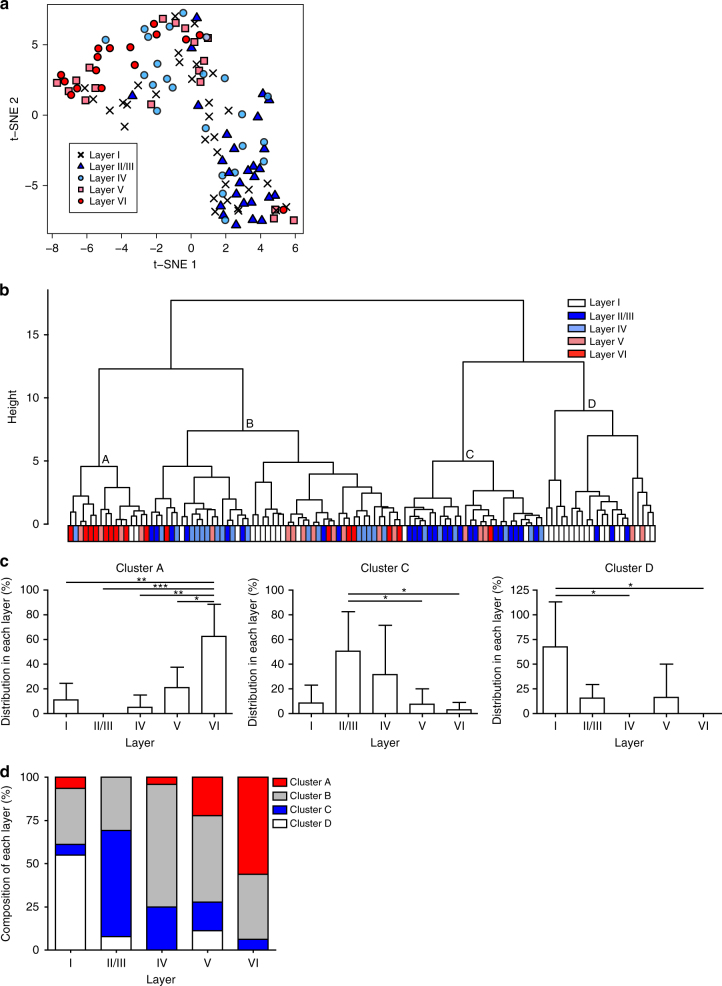
Fig. 2.
Cluster analysis based on morphological features of neocortical astrocytes. a t-SNE analysis showing separation of neocortical astrocytes into two groups, with most cells in layer II/III and those in layers V and VI localizing to different groups. b Hierarchical clustering showing that neocortical astrocytes can be separated into four clusters designated A through D, with cluster A being enriched in astrocytes of layers V and VI, cluster C in those of layer II/III, and cluster D in those of layer I. c Percentage of astrocytes in each cluster located in the different neocortical layers (cluster A, n = 16; cluster C, n = 28; cluster D, n = 22). Data are means ± s.d. for at least three mice. *P < 0.05, **P < 0.01, ***P < 0.001 (one-way ANOVA followed by Bonferroni’s test). d Percentage of astrocytes in each layer belonging to clusters A through D (layer I, n = 31; layer II/III, n = 27; layer IV, n = 24; layer V, n = 18; layer VI, n = 16). Two-sided Fisher’s exact test, P = 8.439 × 10⁻¹²

