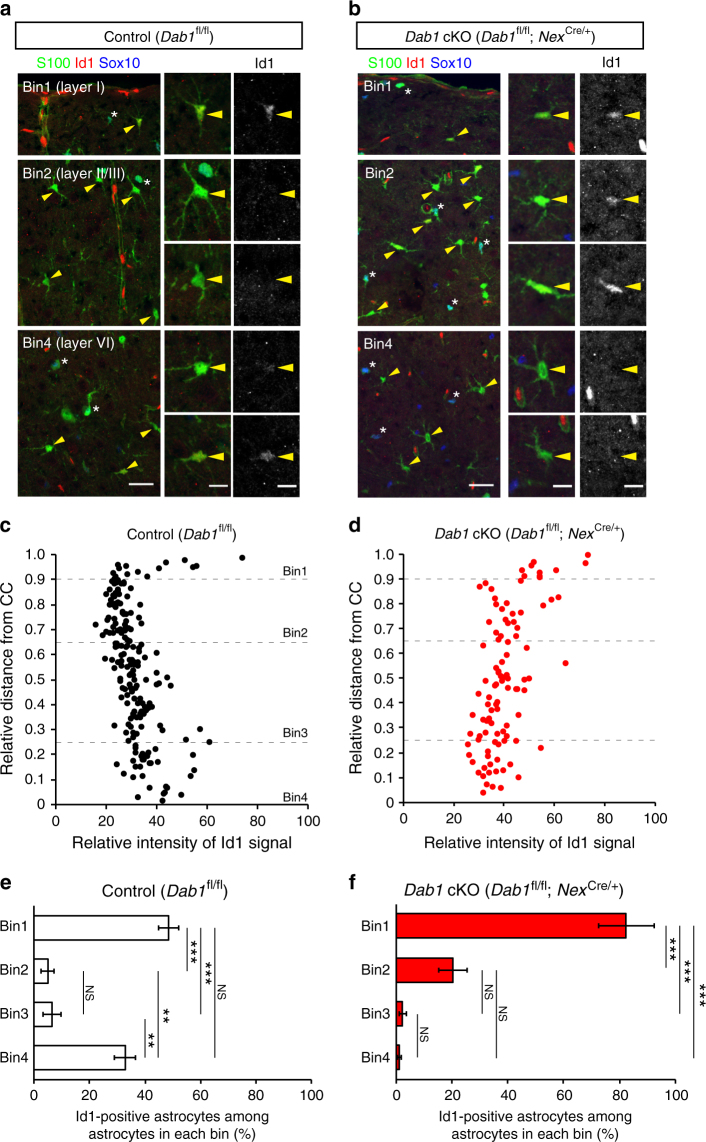
Fig. 6.
Layer-specific expression of Id1 in neocortical astrocytes and its disruption in Dab1 cKO mice. a, b Immunofluorescence staining for S100, Sox10, and Id1 in coronal sections of control (Dab1fl/fl) (a) and Dab1 cKO (Dab1fl/fl;NexCre/+) (b) mice at P30. Astrocytes were identified as S100-positive, Sox10-negative cells (arrowheads); asterisks indicate double-positive cells. Individual astrocytes and Id1 signals are shown in the right panels at higher magnification. Scale bars, 25 µm (left panels) and 10 μm (right panels). c, d Representative data of Id1 signal intensities in the nucleus of individual astrocytes in a coronal section from a control (c) and a Dab1 cKO (d) mouse. Astrocyte position in the cortical layers is expressed as relative distance from the corpus callosum (CC) to the pia, with dashed lines indicating the boundaries between bins: bin1, 0.9–1.0; bin2, 0.65–0.9; bin3, 0.25–0.65; and bin4, 0–0.25. e, f Percentage of Id1-positive astrocytes among total astrocytes in each bin of the neocortex of control (e) and Dab1 cKO (f) mice (n = 3 mice). Perivascular astrocytes are excluded from quantification. Data are means ± s.e.m. from three mice of each genotype. **P < 0.01; NS, not significant (one-way ANOVA followed by Bonferroni’s test)

