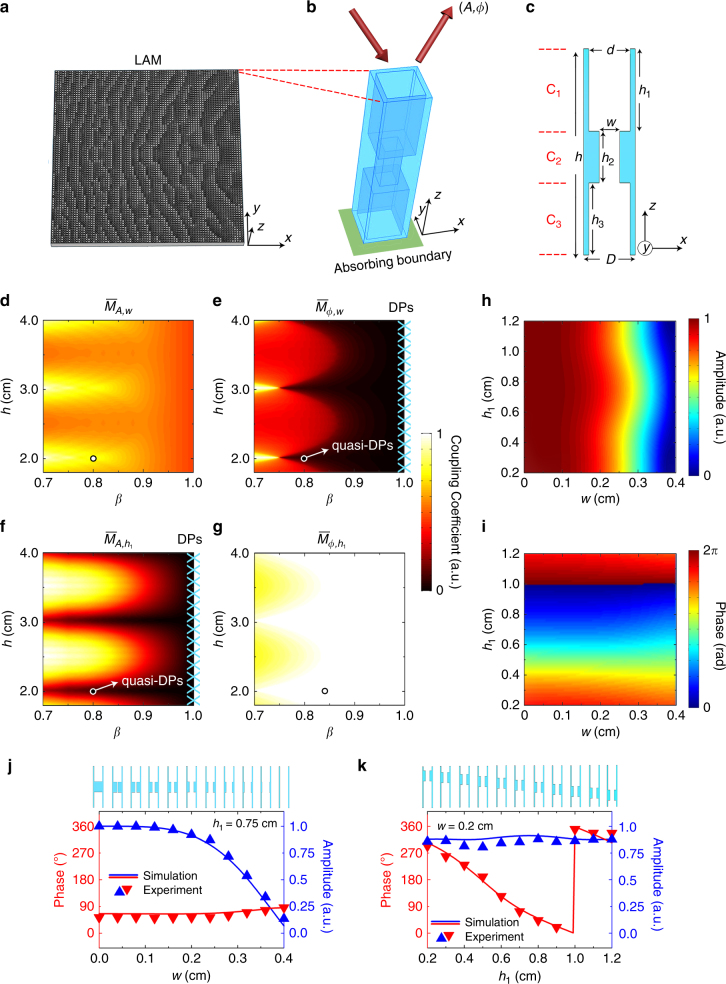
Fig. 1.
Decoupled modulation of reflection amplitude and phase. a–c Schematic diagram of holey lossy metamaterials with an absorbing boundary at the back side in a, three-dimensional (3D) illustration in b and cross-section view of a unit cell in c are appended. d–g The coupling coefficients vs. h and β with decoupled points (DPs) and quasi-DPs marked by the crosses and arrows, respectively. h, i The reflection amplitude and phase responses to the parameters h1 and w for a unit cell operating at quasi-DPs. j, k The simulated and measured amplitude and phase vs. w and h1, respectively, which reveals that the reflection amplitude and phase are controlled by only one parameter, respectively. The simulations are carried out by the finite element solver in commercial software COMSOL MultiphysicsTM5.0

