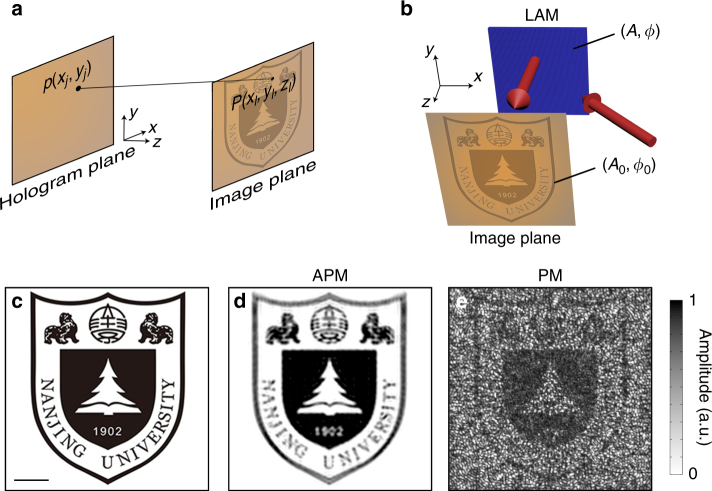
Fig. 2.
High-fidelity acoustic hologram. a Schematic diagram of hologram reconstruction. b Schematic diagram of how the lossy acoustic metamaterial (LAM) projects high-quality acoustic hologram in simulation and experiment. c The target image of Nanjing University logo with complex amplitude distributions. Scale bar, 20 cm. d The simulated holographic image by the amplitude-phase-modulation (APM) method. e The simulated holographic image by the phase-modulation (PM) method. Permissions for use of the Nanjing University logo in this figure were obtained from Nanjing University. All rights reserved

