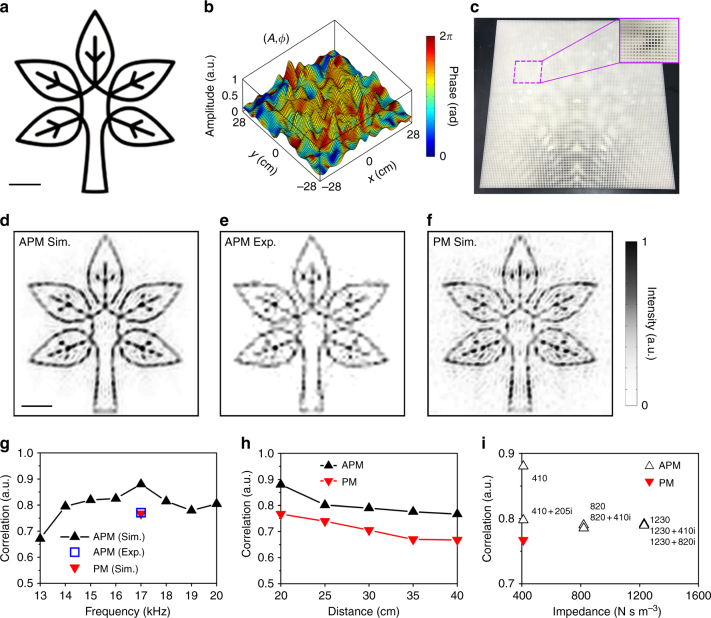
Fig. 5.
Experimental verification of single-plane acoustic hologram. a The predesigned image of a tree. Scale bar, 10 cm. Rights for use of this image are from Dreamstime (www.dreamstime.com). All rights reserved. b Amplitude and phase profiles on the hologram plane for projecting the tree image. c The photograph of the 3D printed LAM sample. d, e The simulated holographic image by the APM method and the experimentally measured result. Scale bar, 10 cm. f The simulated holographic image by the PM method. g The correlation between the resulting image and the predesigned image at different frequencies from 13 to 20 kHz for APM, and at 17 kHz for PM. h The correlation between the resulting image and the predesigned image when the image plane locates at different distances. i The correlation between the resulting image and the predesigned image for different back impedances

