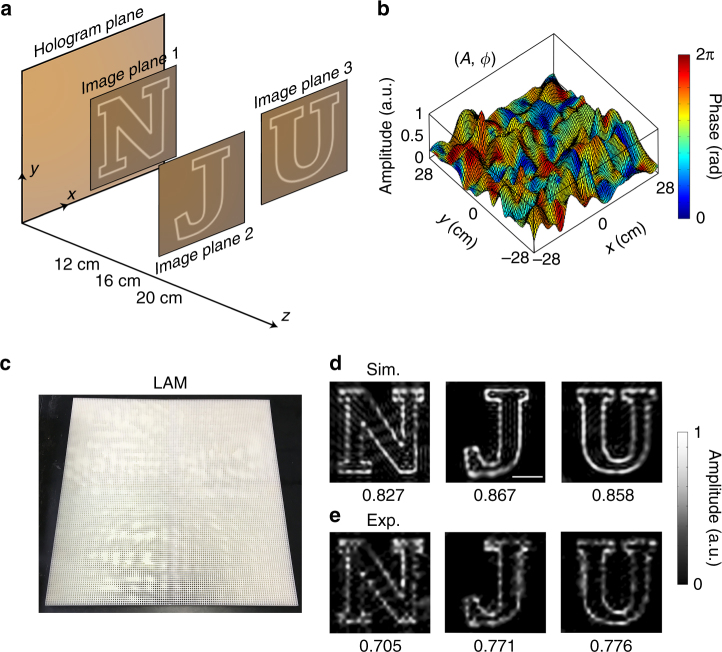
Fig. 6.
Experimental verification of multi-plane acoustic hologram. a The predesigned image of a multi-plane acoustic hologram (letters “N,” “J,” and “U” at different distances of 12, 16, and 20 cm). b Amplitude and phase profiles on the hologram plane for projecting the “N,” “J,” “U” images at multiple planes. c The photograph of the 3D printed LAM sample. d, e The simulated holographic images by the APM method and the corresponding experimentally measured results. The correlations are marked in the figure. The correlation between the resulting image and the predesigned image is appended below each sub-figure. Scale bar, 10 cm. Rights for use of the NJU font images in this figure are from Adobe Font Software License: https://www.fontspring.com/lic/ztxtzqqpzi. All rights reserved

