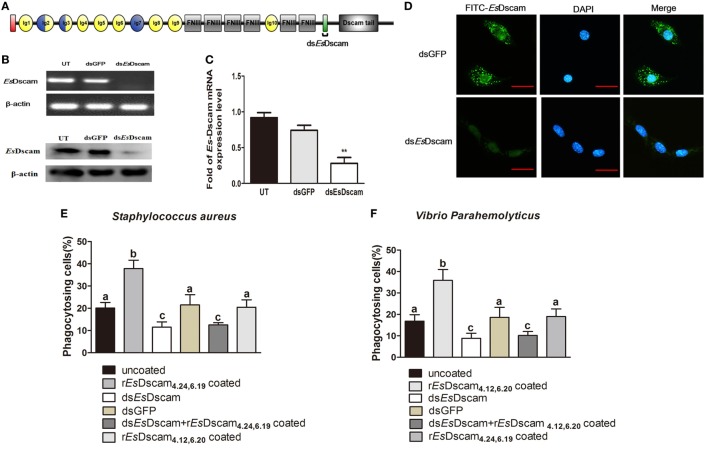
Figure 7.
Soluble EsDscam promotes phagocytosis via membrane-bound EsDscam in hemocytes. (A) Schematic diagram showing the RNAi region recognized by primers in the conserved transmembrane region of dsEsDscam. (B–D) Knockdown of EsDscam expression. Crab hemnocyte were transfected with EsDscam dsRNA (5 nM) and equal amounts of GFP dsRNA served as a control. RNA samples were collected at 24 h post-transfection to check the silencing efficiency by RT-PCR (left panel) and qRT-PCR (right panel) with β-actin as a reference. And the protein samples also were collected and detected by Western blotting with β-actin as a reference. RT-PCR data are representative of two independent repeats. At least three crab were used for each sample, and qRT-PCR were performed three times. The results are expressed as the mean ± SD, data were analyzed by Student’s t-test. **p < 0.01. (Right panel) Immunocytochemical analysis of EsDscam dsRNA transfected hemocyte showing decreased EsDscam protein expression compared with dsGFP-treated control cells. Scale bar = 15 µm. Data are representative of three independent repeats. (E,F) Membrane-bound EsDscam regulate soluble EsDscam promoted phagocytosis in hemocyte. Rate of hemocyte phagocytosis of (E) Staphylococcus aureus and (F) Vibrio parahemolyticus following EsDscam knockdown. Phagocytic rates of hemocytes were calculated according to the formula presented in the Materials and Methods section. Three independent repeats were performed, and results are expressed as the mean ± SD. Data were analyzed by one-way ANOVA and the letters (a, b, c) presented significant differences (p < 0.05).

