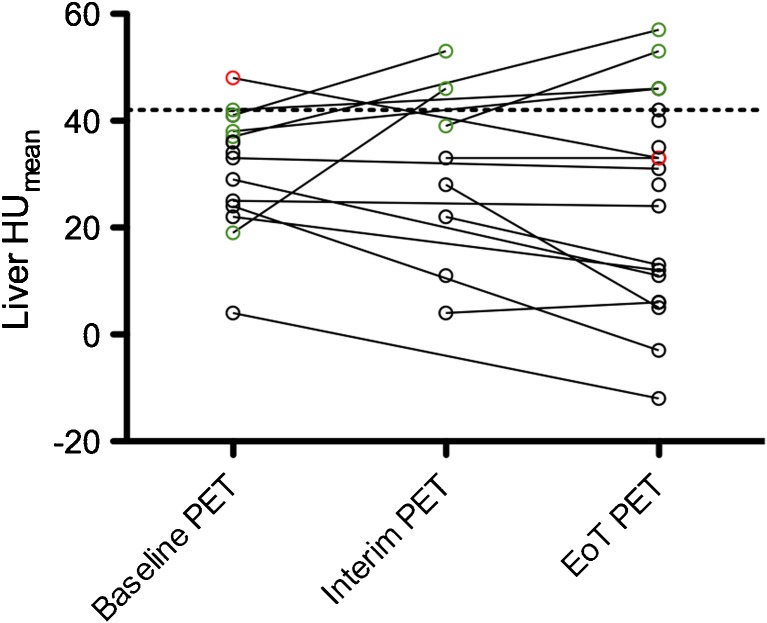
Fig. 2.
Evolution of liver steatosis over the time-course of treatment. All patients who had a steatotic liver on at least one of their examinations are displayed (n = 23). Noticeably, ten of them had only one PET-CT examination during the time-period considered. EoT: End Of Treatment, HU: Hounsfield Density

