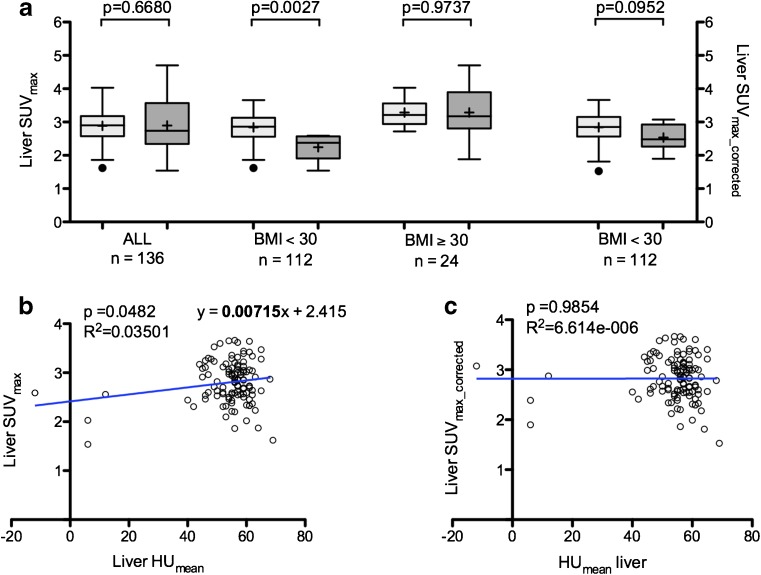
Fig. 6.
Impact of steatosis on liver SUV max in the EoT group. Liver SUVmax values of steatotic and non-steatotic patients before and after correction regarding liver density/steatosis (a). Data are shown as Tukey boxplots (lines displaying median, 25th and 75th percentiles; cross represents the mean value). Correlation between liver SUVmax values and liver HUmean values of BMI < 30 kg/m2 patients before (b) and after (c) correction regarding liver density/steatosis. EoT: End of Treatment

