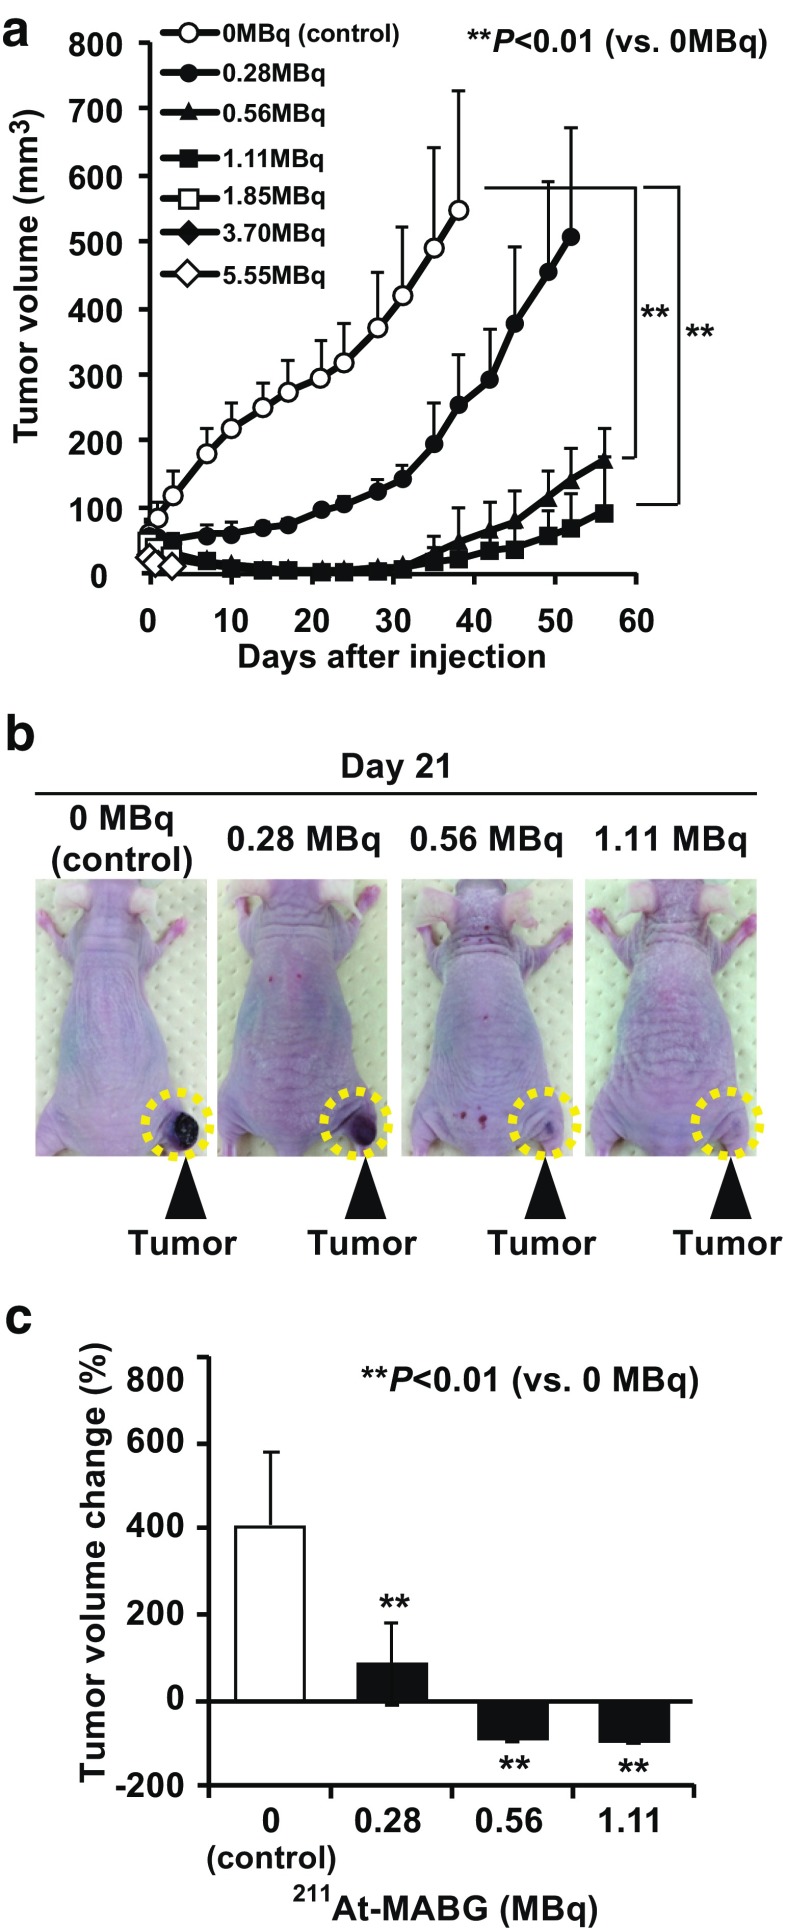
Fig. 2.
Effects of 211At-MABG on tumor volume in PC12 tumor-bearing mice. a Tumor growth curves after treatment with 211At-MABG (five mice per group). **p < 0.01 vs. 0 MBq (control). b Representative images of mice on day 21 after treatment with 211At-MABG and control (0 MBq). Dashed circles indicate tumors. c Tumor volume percentage change on day 21 after treatment with 0, 0.28, 0.56 and 1.11 MBq of 211At-MABG (five mice per group). **p < 0.01 vs. 0 MBq

