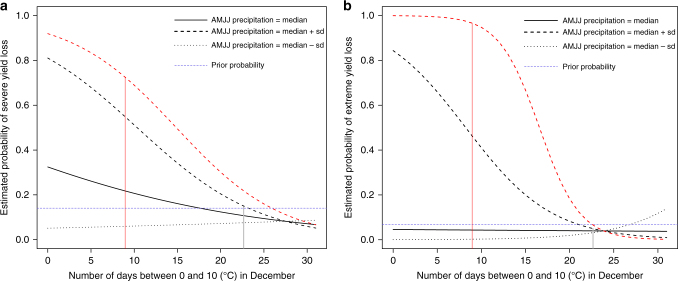
Fig. 4.
Autumn–spring interaction. Modulation by spring precipitation of the relationship between the number of days between 0 and 10 °C in December and the probability of severe (a) and extreme wheat yield loss (b). Interactions are shown here for normal precipitation (daily AMJJ precipitation equal to the median over 1959–2016; bold line), and for wet and dry spring conditions (daily AMJJ precipitation equal to +/− one standard deviation; dotted lines). Vertical grey line: median number of days with maximum temperature between 0 and 10 °C over 1958–2016; red dotted lines: modeled value for 2016

