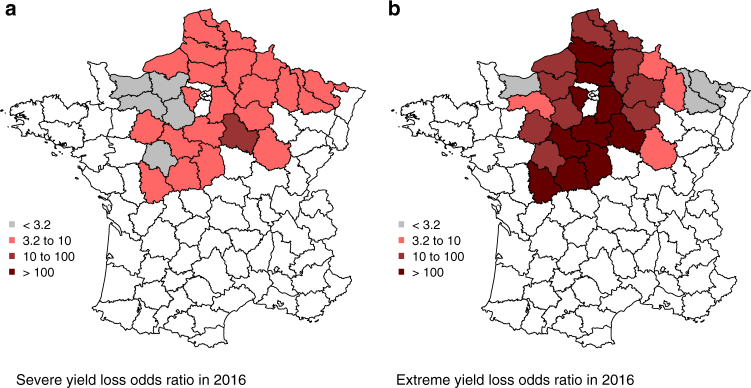
Fig. 5.
Odds of yield loss in 2016. Odds ratios of severe (a) and extreme (b) yield loss in the study area from the best models trained on yield data excluding 2016. Data are shown in Supplementary Table 3. Models include temperature and precipitation conditions in the late autumn and spring. We rely on the odds ratio classification by68 with values from 1 to 3.2 not worth more than a bare mention, between 3.2 and 10 suggesting substantial evidence, from 10 to 100 strong and above 100 decisive. The maps were generated with R based on the yield data used in the analyses

