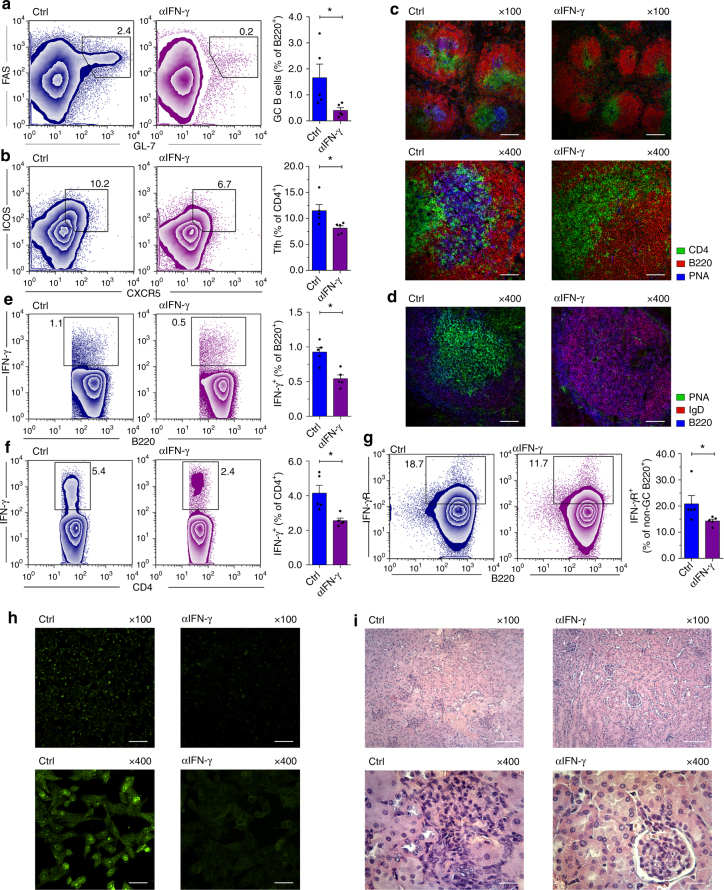
Fig. 6.
IFN-γ signaling blockade prevents spontaneous GC formation and lupus-like disease. a, b Representative plots and statistical analysis of the frequency of GC B cells and Tfh cells in the spleen of Ig-control Gal-3 KO (Ctrl) and anti-IFN-γ-treated Gal-3 KO mice (αIFN-γ), respectively (n = 5 for each group). c Immunofluorescence of frozen spleen sections (7 μm) from Ctrl and αIFN-γ mice stained with anti-CD4 (green), anti-B220 (red) and PNA (blue). Magnification: ×100 (top) and ×400 (bottom) (n = 5 for each group). Scale bar, 200 μm (upper panels) and 50 μm (lower panels). d Immunofluorescence of frozen spleen sections (7 μm) from Ctrl and αIFN-γ mice stained with PNA (green), anti-IgD (red) and anti-B220 (blue). Magnification: 4×00 (n = 5 for each group). Scale bar, 50 μm. e Representative plots and statistical analysis of the frequency of IFN-γ-producing B220+ cells in the spleen of Ctrl and αIFN-γ mice (n = 5 for each group). f Representative plots and statistical analysis of the frequency of IFN-γ-producing CD4+ T cells in the spleen of Ctrl and αIFN-γ mice (n = 5 for each group). g Representative plots and statistical analysis of the frequency of B220+ GL7− FAS− non-GC IFN-γR+ B cells in the spleen of Ctrl and αIFN-γ mice (n = 5 for each group). h ANA IgG determined with Hep-2 slides in sera from Ctrl and αIFN-γ mice. Magnification: ×100 (top) and x400 (bottom) (n = 5 for each group). Scale bar, 200 μm (upper panels) and 50 μm (lower panels). i Kidney sections from Ctrl and αIFN-γ mice stained with H&E. Magnification ×100 (top) and ×400 (bottom) (n = 5 for each group). Scale bar, 100 μm (upper panels) and 20 μm (lower panels). Ig-Control Gal-3 KO mice (Ctrl) are indicated in blue and αIFN-γ-treated Gal-3 KO mice (αIFN-γ) in violet. Data are the mean ± s.e.m. *p < 0.05 (unpaired Student’s t-test). a–i Data are representative of two independent experiments

