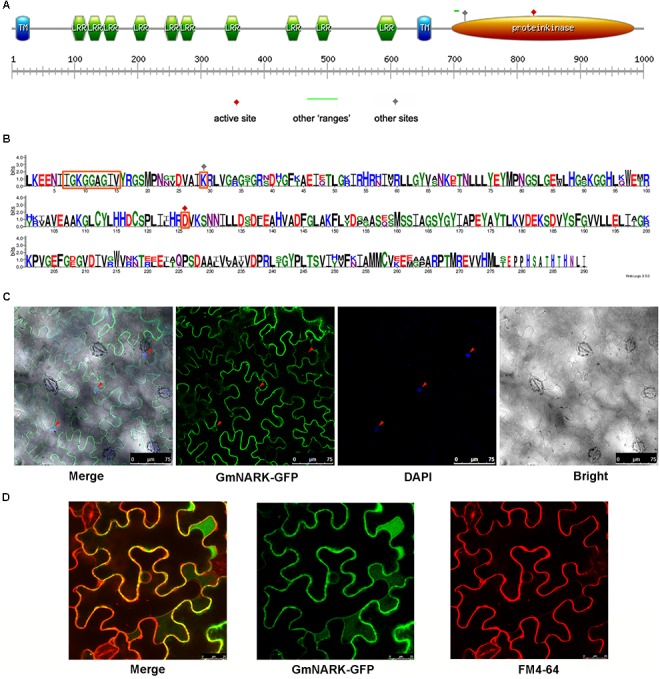
FIGURE 4.

GmNARK protein structure analysis and subcellular location. (A) Protein domain analysis of GmNARK. (B) Protein sequence alignment between GmNARK and AtCLV1. (C) Sub-cellular location analysis of GmNARK-GFP. The image of GmNARK-GFP and DAPI fluorescence in Nicotiana benthamiana cells. (D) Sub-cellular location analysis of GmNARK-GFP. The image of GmNARK-GFP and membrane staining marker (FM4-64) fluorescence in N. benthamiana cells.
