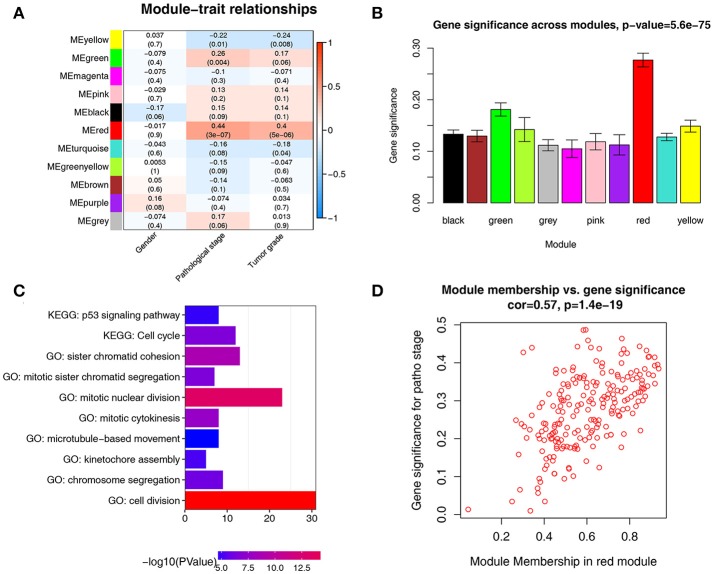
Figure 4.
Identification of modules associated with the clinical traits of ccRCC. (A) Heatmap of the correlation between module eigengenes and clinical traits of ccRCC. (B) Distribution of average gene significance and errors in the modules associated with pathological stage of ccRCC. (C) GO functional and KEGG pathway enrichment analyses for genes in the red module. The –log10 (P-value) of each term is colored according to the legend. (D) Scatter plot for correlation between gene module membership in the red module(patho-module) and gene significance.

