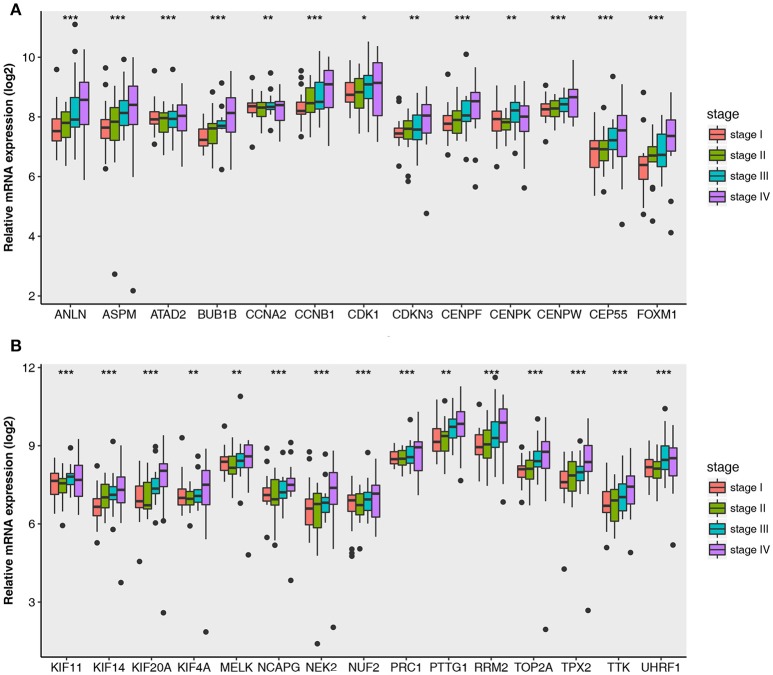
Figure 6.
Boxplots of hub genes across different pathological stages in the validation dataset GSE53757. The boxplots show the medians and dispersions of the samples of different pathological stages for each hub gene. (A) Boxplots of hub genes from ANLN to FOXM1 (sort in alphabetical order) in different pathological stages. (B) Boxplots of hub genes from KIF11 to UHRF1 in different pathological stages. P-values are the results of one-way ANOVA for different pathological stages. *p < 0.05, **p < 0.01, ***p < 0.001.

