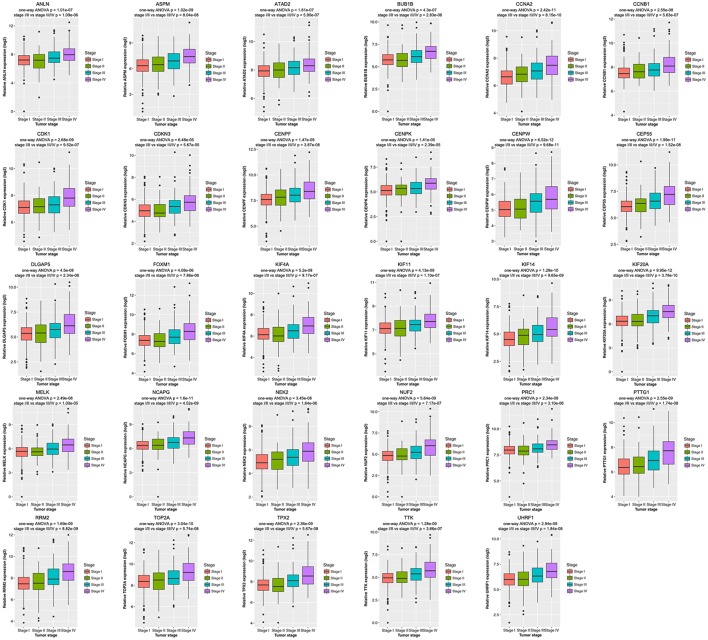
Figure 7.
Boxplots of hub genes across different pathological stages in the TCGA dataset. The boxplots show the medians and dispersions of the samples of different pathological stages for each hub gene. P-values are the results of independent sample t-test between pathological stage I/II and III/IV and one-way ANOVA for different pathological stages.

