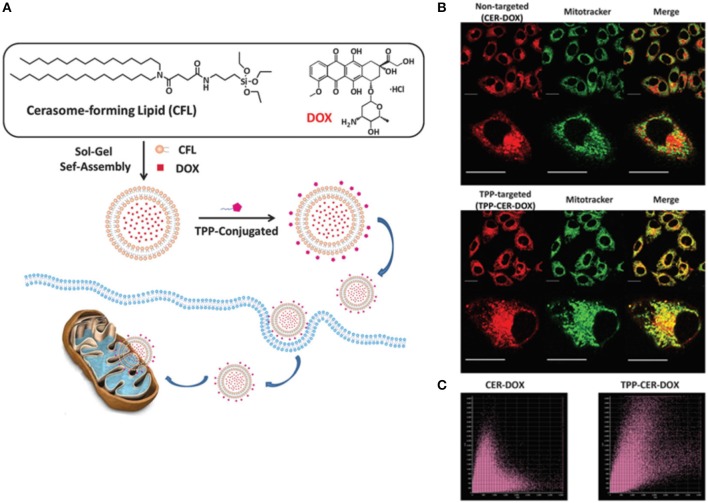
Figure 2.
(A) Schematic illustration of the formation process of the doxorubicin-loaded cerasomes (CER–DOX) and TPP modified cerasomes (TPP–CER– DOX). Mitochondrial localization of CER–DOX and TPP–CER–DOX. HeLa cells were exposed to non-targeted CER–DOX and TPP-targeted TPP– CER–DOX for 4 h (scale bar: 20 mm). The cells were then stained with mitochondrial marker Mito-Tracker Deep Red for 30 min. The staining solution was washed with pH 7.4 PBS and the cells were observed by fluorescence microscopy. (B) The merge images showed that the overlap of Mito-Tracker (green) and CER–DOX (red) was unobvious (top), while the overlap of TPP–CER–DOX was significant (down). (C) The Pearson's coefficient analysis plots of CER–DOX (left) and TPP–CER–DOX (right) (Wang et al., 2015).

