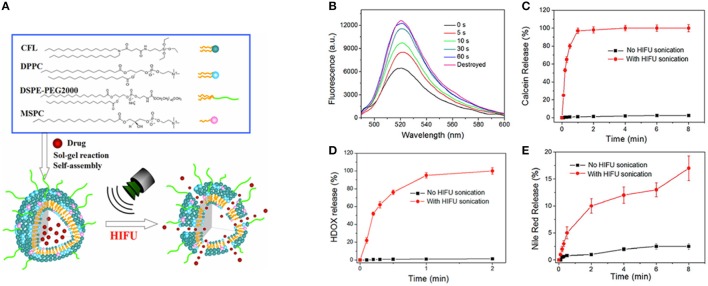
Figure 3.
(A) Schematic illustration for the formation of drug loaded HTSCs and the drug release from HTSCs upon HIFU sonication. (B–E) HIFU triggered drug release profile of HTSCs. (B) Fluorescence spectra of the calcein loaded HTSCs-3; (C) release profile of the calcein loaded HTSCs-3; (C) Release profile of the Nile red loaded HTSCs-3; (D) release profile of the HDOX loaded HTSCs-3 with a working voltage of 190 mV and DC of 30%. Note that the initial temperature was 37°C in the case of no HIFU sonication (Liang et al., 2015).

