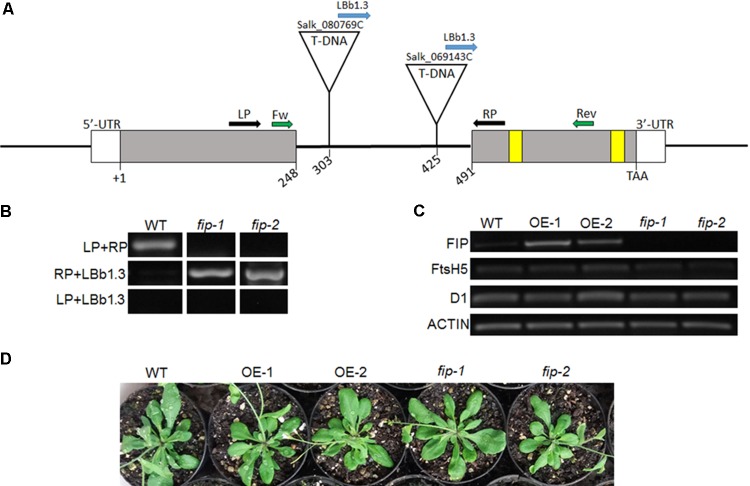
FIGURE 4.
Characterization of FIP plants. (A) Diagram of the FIP gene in Arabidopsis. Exons are depicted as solid gray boxes. The cysteine residues of the zinc-finger domain are represented as yellow boxes. The T-DNA insertion sites in the intron region of the FIP gene (At5g02160) for SALK lines 080769C (fip-1) and 069143C (fip-2) are shown. The annealing sites for the primers are represented by arrows: black pair were used to confirm the mutants along with the blue; green pair were used to RT-PCR analysis. (B) Confirmation of mutants knockdown FIP. A 307 pb fragment was amplified using de LP and RP in wild-type (WT) plants. A 512 or 390 pb fragment was amplified using de RP and LBb1.3 in homozygous plants of the mutants fip-1 and fip-2, respectively, and no amplification was expected using the LP and LBb1.3 primers, considering an upstream orientation of the T-DNA insertion. (C) Profiles of FIP, FtsH5, and D1 mRNA accumulation in WT, OE lines, and fip knockdown mutant plants growing under control conditions for 21 days. Total RNA was isolated from leaves of Arabidopsis thaliana. cDNA synthesis was performed using 1 μg of total RNA. RNA accumulation was determined by semi-quantitative PCR analysis. ACTIN gene expression was used as a control. (D) Phenotypes of three-week-old WT plants, overexpressing (OE) lines, and fip knockdown mutants growing under control conditions (22°C, 16 h/8 h light/dark, 120 μmol m-2 s-1).

