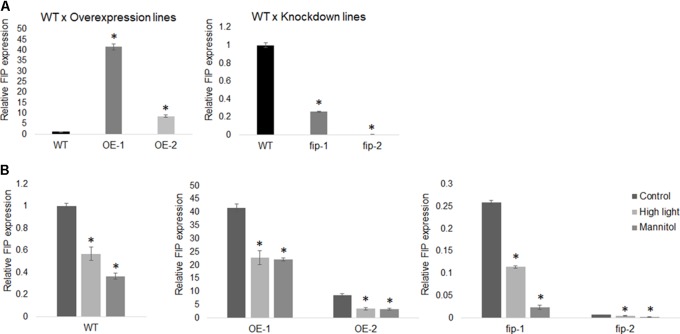
FIGURE 5.
FIP expression profile. (A) The relative transcript levels of FIP in WT plants is 1.0 when compared with the overexpression lines OE-1 and OE-2 or with the knockdown mutants fip-1 and fip-2. (B) FIP expression is down-regulated by high light and osmotic stresses. Three-week-old plants growing under control conditions (22°C, 16 h/8 h light/dark, 120 μmol m-2 s-1) were submitted to a 24-h stress as follows: 400 μmol m-2 s-1 (high light) or 300 mM of mannitol (osmotic stress). The relative expression was assayed by real-time RT-PCR and calculated by the ΔCP method using ACTIN expression as a reference gene. Values were normalized in relation to the WT expression as 1. Data are the mean ± SD (n = 6). Statistically significant differences are indicated by asterisks (Student’s t-test, P < 0.05) for comparisons of the OE lines and fip knockdown mutants with WT plants.

