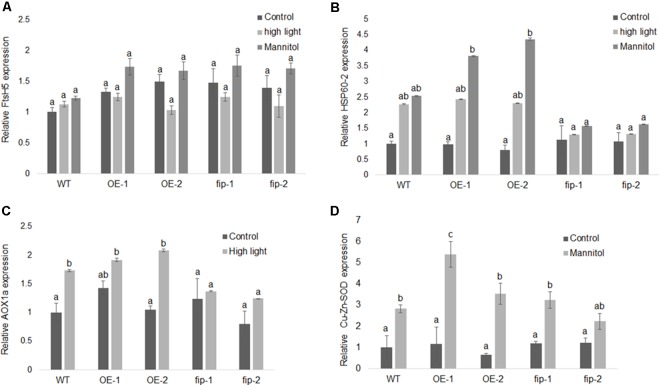
FIGURE 6.
Expression of different genes in response to stress conditions. Real-time RT-PCR analysis was conducted using WT plants, FIP overexpression lines (OE-1 and OE-2), and fip knockdown mutants (fip-1 and fip-2). Three-week-old plants growing under control conditions (22°C, 16 h/8 h light/dark, 120 μmol m-2 s-1) were submitted to a 24-h stress as follows: 400 μmol m-2 s-1 (high light) or 300 mM of mannitol (osmotic stress). (A) Relative transcript levels of FtsH5 subjected to high light or osmotic stress. (B) Relative transcript levels of HSP60-2 in plants subjected to high light or osmotic stress. (C) Relative transcript levels of AOX1a in plants subjected to high light stress. (D) Relative transcript levels of Cu-Zn-SOD in plants subjected to osmotic stress. The relative expression was calculated by the ΔCP method using ACTIN expression as the reference gene. Values were normalized in relation to the WT expression as 1. Data are the mean ± SD (n = 6). Statistically significant differences are indicated by different lower-case letters (One-way ANOVA followed by Tukey, P < 0.05) when comparing all plants in the same graphic.

