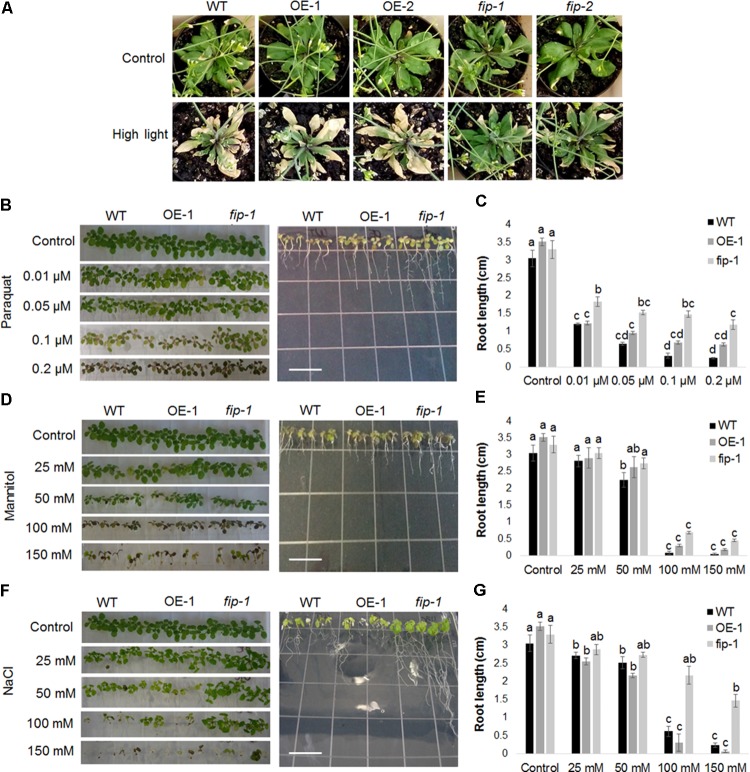
FIGURE 7.
The fip knockdown mutants are more tolerant to abiotic stress. (A) Effects of high light stress on plants expressing different amounts of FIP transcripts. Three-week-old WT plants, FIP overexpression lines (OE-1 and OE-2), and fip knockdown mutants (fip-1 and fip-2) growing under control conditions (22°C, 16 h/8 h light/dark, 120 μmol m-2 s-1) were subjected to high light stress (22°C, 16 h/8 h light/dark, 400 μmol m-2 s-1) for 11 days. Plants were watered every 2 days throughout the period. (B–G) WT plants, an FIP overexpression line (OE-1), and the fip knockdown mutant (fip-1) were grown in 0,5X MS plates for 7 days and then transferred to the respective stress treatment for 10 days. The plates were maintained in a room under control conditions (22°C, 16 h/8 h light/dark, 120 μmol m-2 s-1). (B) Plants subjected to oxidative stress. Effect of increasing amounts of paraquat (0.01, 0.05, 0.1, and 0.2 μM) on plant leaves (left). Effects of 0.2 μM of paraquat on plant root growth (right). (C) Average root length of plants subjected to increasing amounts of paraquat. (D) Plants subjected to osmotic stress. Effects of increasing amounts of mannitol (25, 50, 100, and 150 mM) on plant leaves (left). Effects of 100 mM of mannitol on plant root growth (right). (E) Average root length of plants subjected to increasing amounts of mannitol. (F) Plants subjected to salt stress. Effects of increasing amounts of NaCl (25, 50, 100, and 150 mM) on plant leaves (left). Effects of 100 mM of NaCl on plant root growth (right). (G) Average root length of plants subjected to increasing amounts of NaCl. All the concentrations were tested in three independent experiments with three repetitions each time with identical results. Data are the mean ± SD (n = 6). Statistically significant differences are indicated by different lower-case letters (One-way ANOVA followed by Tukey, P < 0.05). Scale bar (white) in plates means 1 cm.

