
FIGURE 11.
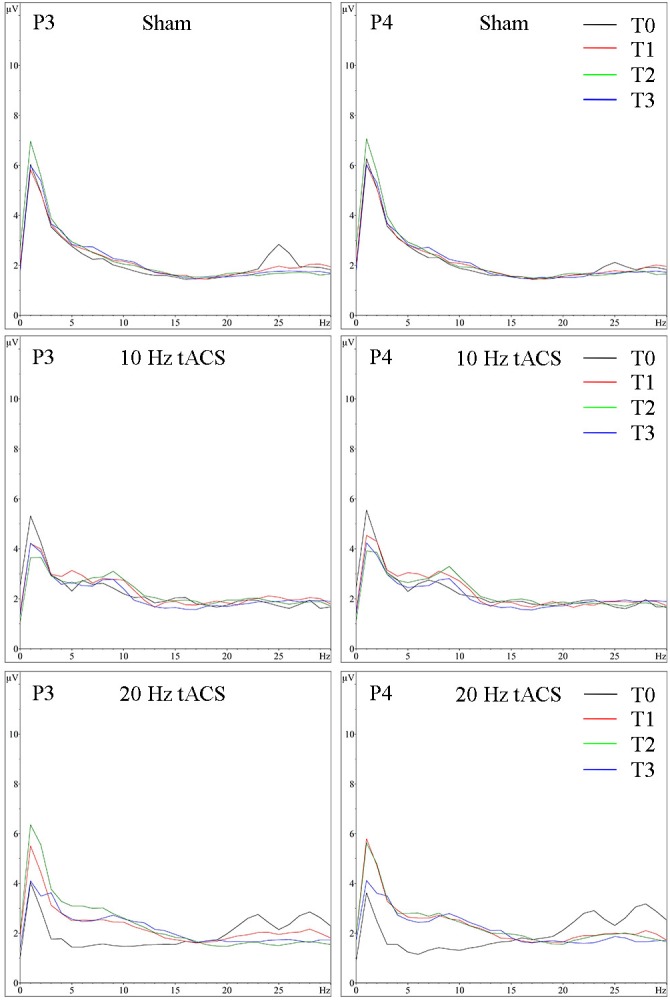
Group averaged EEG activity during motor performance. Frequency spectrum (amplitude in μV) on P3 (left) and P4 (right) during motor performance in the bimanual coordination task preceding tACS (T0 = black), immediately after tACS (T1 = red), 30 min after tACS (T2 = green) and 1 day after tACS (T3 = blue) for Sham (at the top), 10 Hz tACS (in the middle), 20 Hz tACS (at the bottom).