
FIGURE 13.
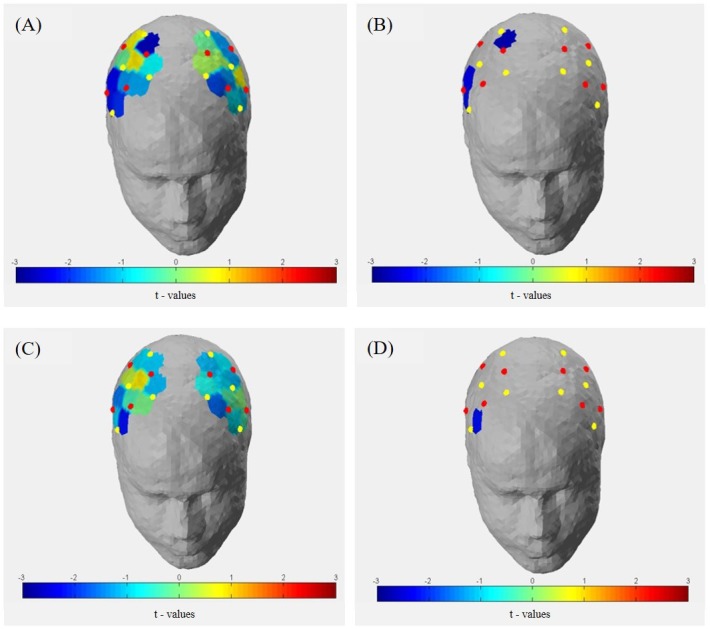
Group averaged t-statistic beta maps. (A) t-contrast of 10 Hz tACS vs. Sham for Hboxy concentrations in all channels during the bimanual coordination task at T1. (B) Significant channels (t-value < –2.4 and >2.4, p < 0.05) were depicted colored in the brain map: channel 12 (S-D) covering the primary somatosensory cortex, channel 19 (S-D) covering the primary motor cortex (BA 4) and channel 20 covering the premotor area (BA 6) of the right hemisphere. (C) t-contrast of 20 Hz tACS vs. sham for Hboxy concentrations in all channels during the bimanual coordination task at T1. (D) Significant channels (t-value < –2.4 and >2.4, p < 0.05) were depicted colored in the brain map: channel 16 (S6-D8) covering the premotor area (BA 6) of the right hemisphere.