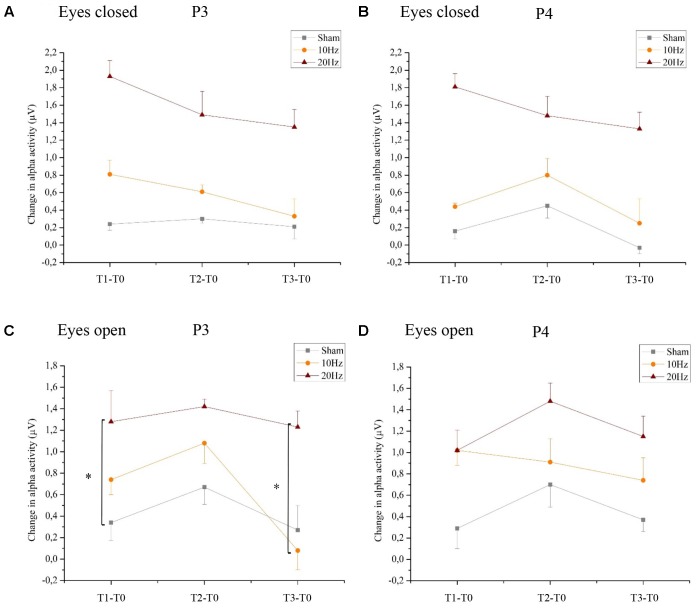
FIGURE 4.
Changes in alpha activity in rest. Changes in alpha activity (μV) in rest from the interval preceding tACS (T0) to T1 (immediately after tACS), T2 (30 min after tACS) and T3 (1 day after tACS) for Sham (gray), 10 Hz tACS (orange) and 20 Hz tACS (ruby). Depicted are means and standard deviations. Note that difference scores are depicted and statistical analysis revealed a significant TIME and GROUP∗TIME interaction effect. The main effects as well as the interaction effects are due to significant changes from T0. All statistical details are depicted in the text [see paragraph Resting alpha activity (8–12 Hz) with eyes closed/open in section “Results”). Significantly different changes in alpha activity after tACS to T0 between the groups are marked and depicted with asterisks (∗ depicts p < 0.05). (A) eyes closed P3, (B) eyes closed P4, (C) eyes open P3, (D) eyes open P4.

