
FIGURE 5.
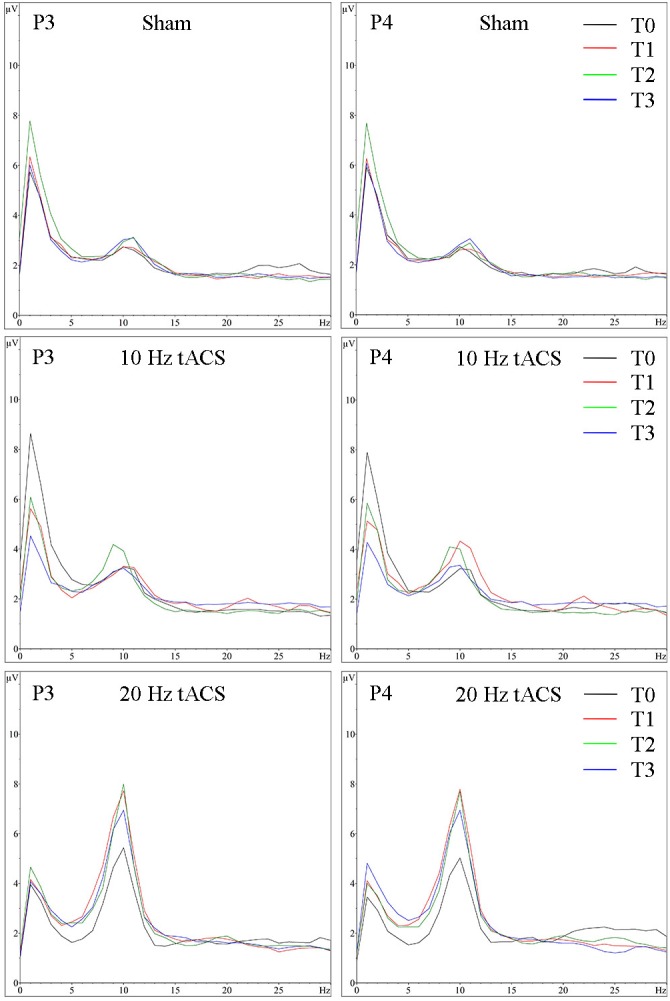
Group averaged EEG activity in rest with eyes closed. Frequency spectrum (amplitude in μV) on P3 (left) and P4 (right) for the interval with eyes closed preceding tACS (T0 = black), immediately after tACS (T1 = red), 30 min after tACS (T2 = green) and 1 day after tACS (T3 = blue) for Sham (at the top), 10 Hz tACS (in the middle), 20 Hz tACS (at the bottom).