
FIGURE 6.
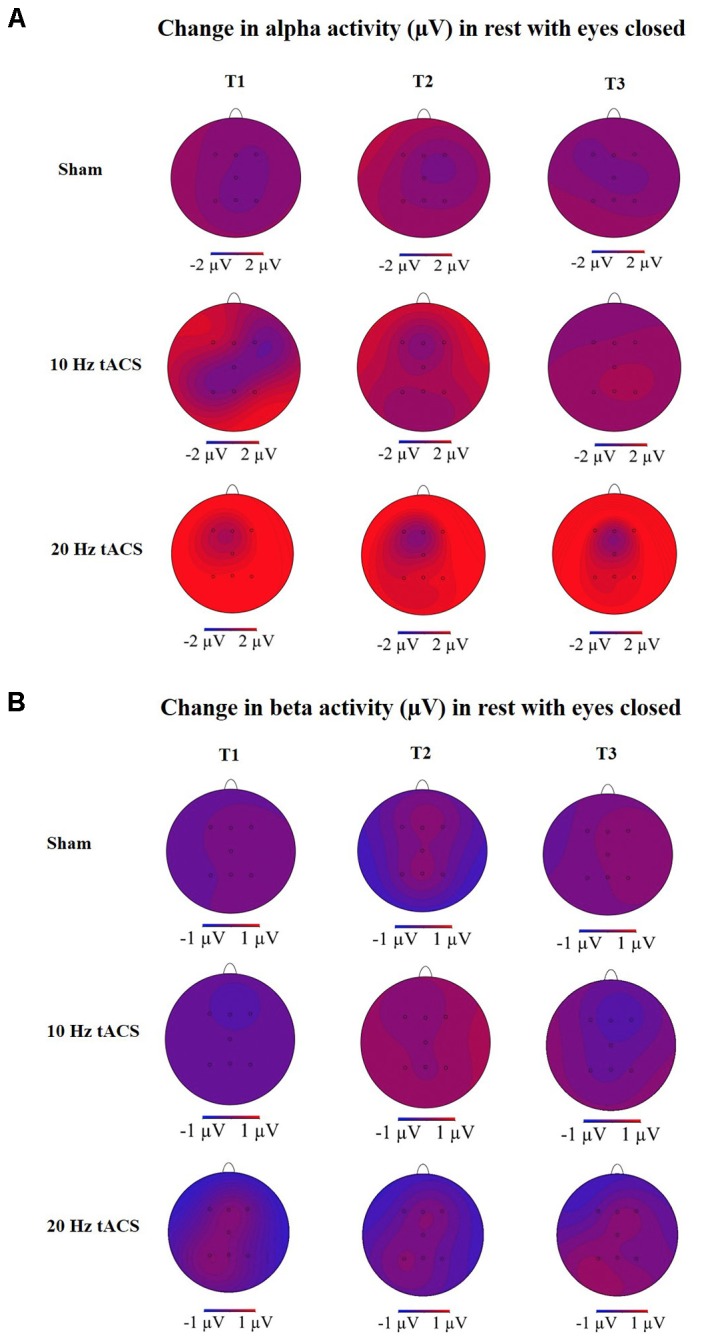
Topographies of group averaged alpha and beta activity changes. (A) Changes in alpha activity (μV) in rest from the interval with eyes closed preceding tACS (T0) to T1 (immediately after tACS), T2 (30 min after tACS), and T3 (1 day after tACS) for Sham (at the top), 10 Hz tACS (in the middle), 20 Hz tACS (at the bottom). (B) Changes in beta activity (μV) in rest from the interval with eyes closed preceding tACS to T1 (immediately after tACS), T2 (30 min after tACS) and T3 (1 day after tACS) for Sham (at the top), 10 Hz tACS (in the middle), 20 Hz tACS (at the bottom). Note that these topographies are based on seven electrode positions only.