
FIGURE 7.
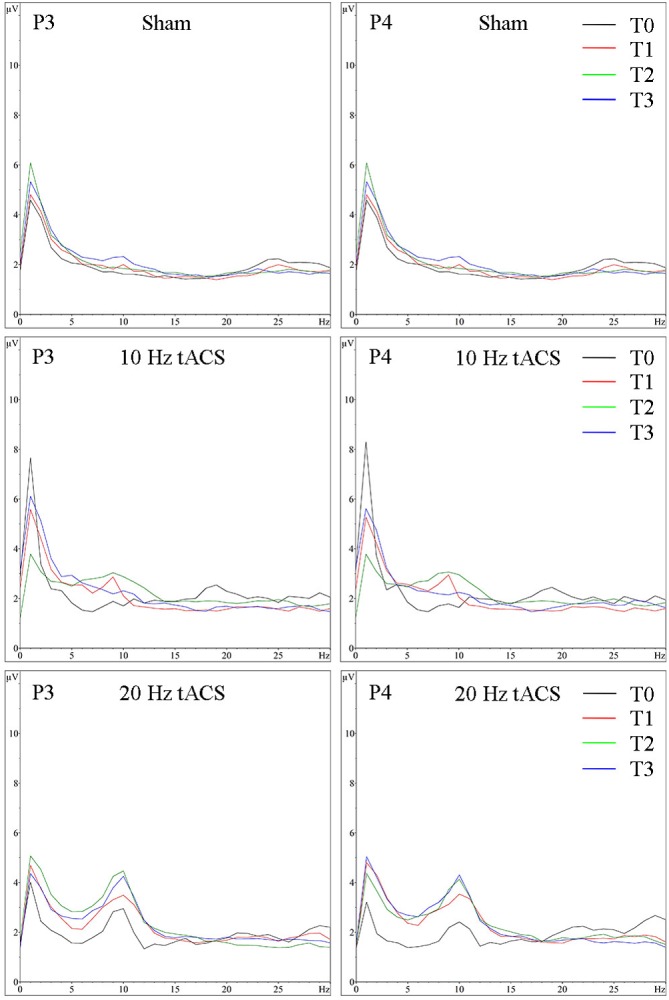
Group averaged EEG activity in rest with eyes open. Frequency spectrum (amplitude in μV) on P3 (left) and P4 (right) for the 1 min interval with eyes open preceding (T0 = black), immediately after tACS (T1 = red), 30 min after tACS (T2 = green) and 1 day after tACS (T3 = blue) for Sham (at the top), 10 Hz tACS (in the middle), 20 Hz tACS (at the bottom).