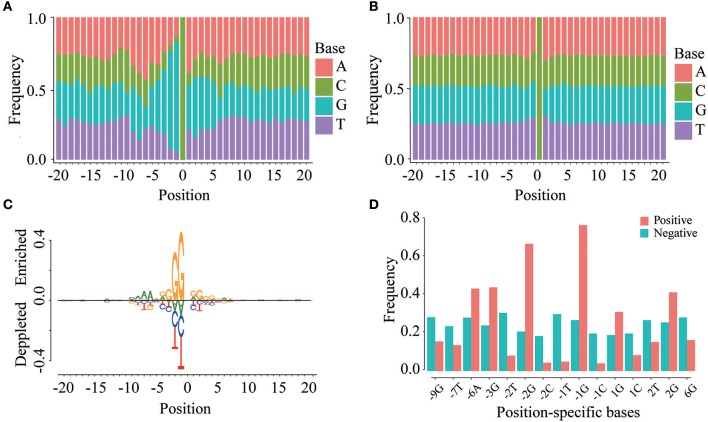
Figure 3.
Position-specific base usage in positive and negative samples. The region around (−20, 20) around the cytosine sites is used to perform position-specific base usage analysis, where the cytosines are defined as 0. (A) Frequencies of 41 × 4 position-specific bases in positive samples. (B) Frequencies of 41 × 4 position-specific bases in negative samples. (C) Two sample logo of the differences between m5C and non-m5C modifications. It shows nucleotides which are enriched or depleted in the surrounding regions of m5C modifications. (D) With a significance level of 1.0E-10, the usage of 15 position-specific bases is significantly different between m5C and non-m5C modifications.

