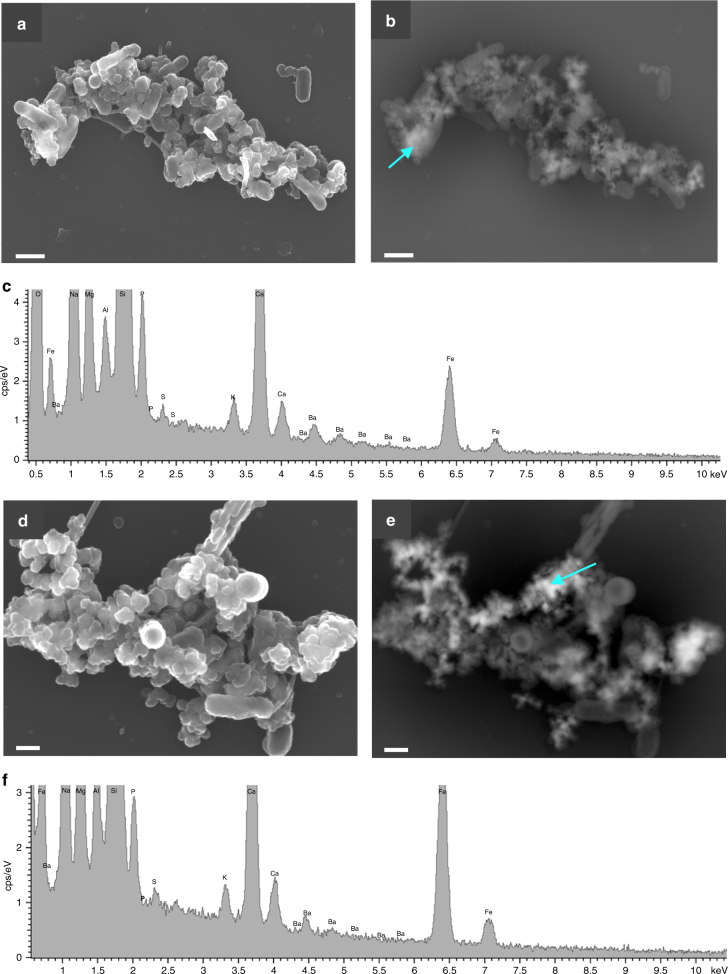
Fig. 2.
SEM images of M. hydrocarbonoclasticus and P. okeanokoites bacteria. a, b Photographs of M. hydrocarbonoclasticus obtained by the Inlens detector and backscattered electron mode, respectively. Scale bar represents 1 μm. c Representative SEM-EDX spectrum. Incubation time was 48 h and the medium SSW2. The corresponding spectrum also shows the composition of the Ba-rich aggregates. d, e Photograph of P. okeanokoites after 96 h of incubation in SSW2 medium obtained under the same microscopy conditions. Scale bar represents 200 nm. f Composition of the precipitates shown in d and e images

