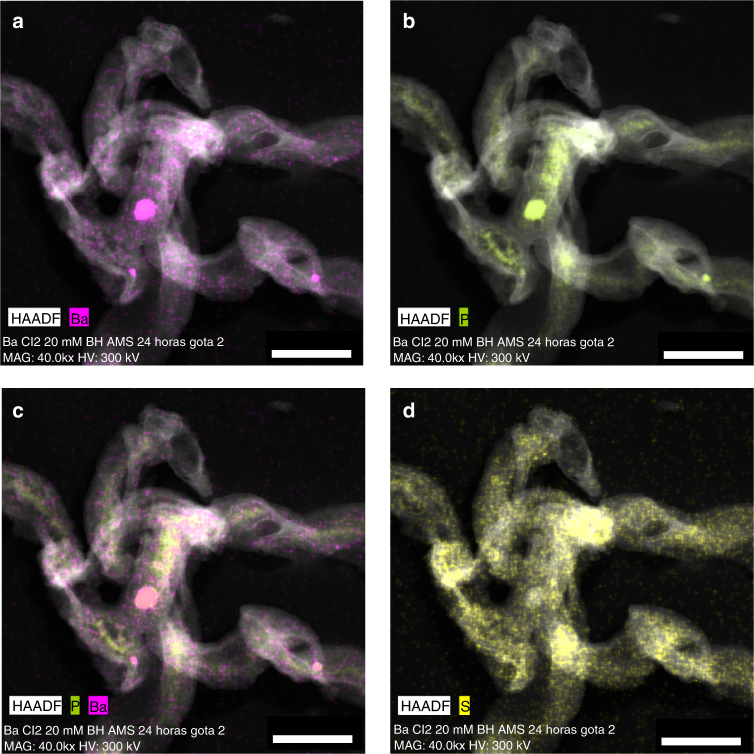
Fig. 3.
HRTEM EDX maps of Ba, P, and S in bacterial cells. a, b High-angle annular dark field (HAADF) STEM images and corresponding EDX maps showing the distribution of Ba and P respectively in bacterial biofilms of I. loihiensis MAH1 after 48 h of incubation in SSW2 medium. c Combined map of Ba and P showing the similar distribution of these elements . d Map of S showing the scattered distribution of this element within bacterial cells. Scale bar represents 400 nm

