Fig. 4.
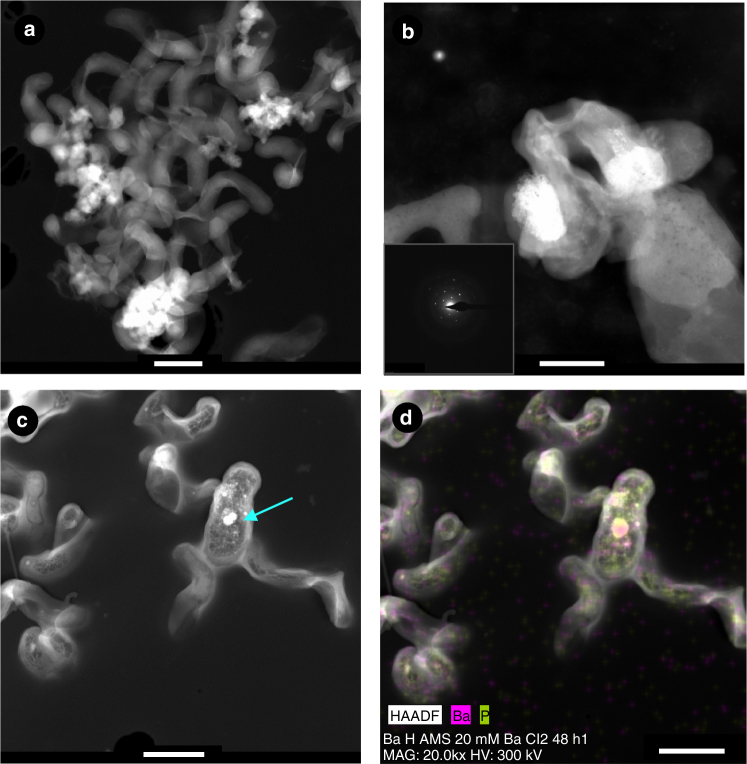
HRTEM images of bacterial biofilms. a HAADF images showing bacterial biofilms of I. loihiensis MAH1. b High-magnification photograph of precipitates formed after 48 h of incubation in SSW2 medium. A selected area electron diffraction image is included in photograph b to show the crystalline nature of the precipitates (the composition is shown in Supplementary Fig. 2). c Intracellular grains enriched in P (indicated with an arrow). d Corresponding EDX map showing the Ba and P distribution (spectrum is provided in Supplementary Fig. 3). Scale bar represents: a 500 nm, b 200 nm, c 500 nm, d 700 nm

