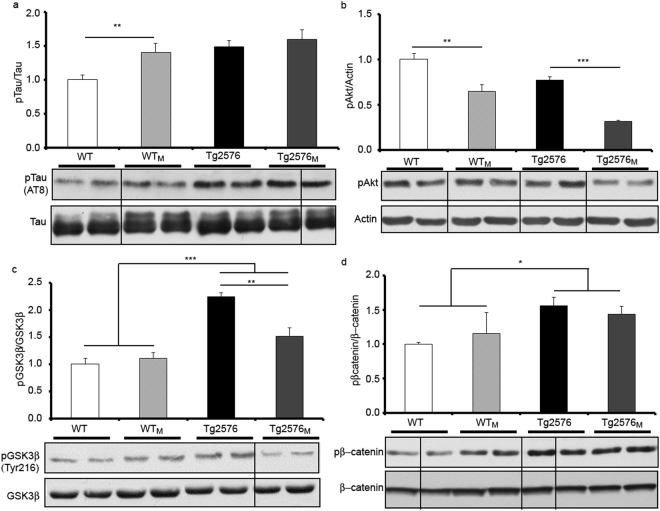
Figure 2.
Levels of Tau, pTau and of proteins involved in regulating Tau phosphorylation. Results from Western blot of hippocampal membrane extracts from WT, WTM, Tg2576 and Tg2576M mice are displayed. We show representative lanes from representative blots (full-length blots are presented in Supplementary Figure 1) and the quantification of immunolabeled bands. The results (fold over control –WT-) are expressed as the mean ± SEM (n = 4). Statistical significance was analysed by two-way ANOVA with Tukey’s post-hoc test (a) pTau versus Tau. (b) pAkt versus actin. (c) pGSK3β (Tyr216) versus GSK3β. (d) pβcatenin versus β-catenin. *p < 0.05, **p < 0.005, ***p < 0.0001.

