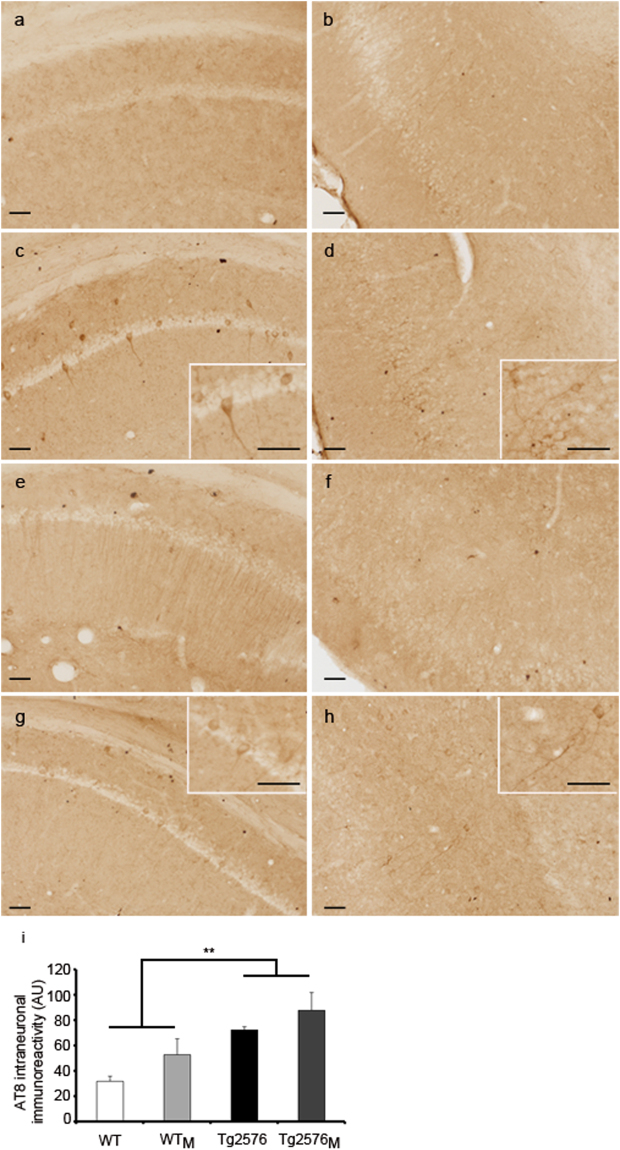
Figure 3.
Immunohistochemistry using the AT8 antibody in hippocampal (a,c,e,g) and entorhinal cortex (b,d,f,h) sections from WT (a,b), WTM (c,d), Tg2576 (e,f) and Tg2576M (g,h) mice. Scale bars: 50 µm. Quantification of AT8 staining per hippocampal section (i). Data are the mean ± SEM of six different areas covering the entire hippocampus from two sections on the anatomically comparable plane for each animal (n = 3). Statistical significance was analysed by two-way ANOVA with Tukey’s post-hoc test. **p < 0.005.

