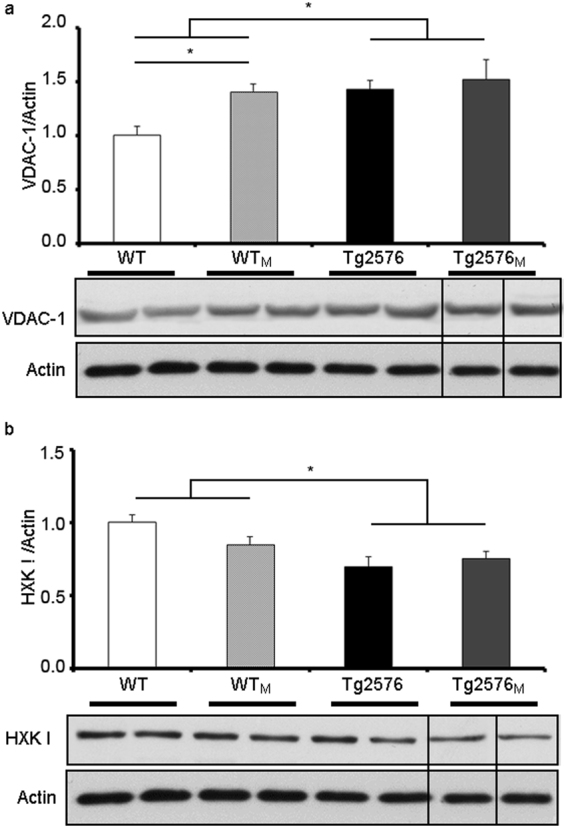
Figure 8.

Levels of selected mitochondrial proteins in hippocampal extracts from WT, WTM, Tg2576 and Tg2576M mice. We show a representative blot and the quantification of immunolabeled bands: VDAC-1 versus actin (a) and hexokinase type 1 (HXKI) versus actin (b). Full-length blots are presented in Supplementary Figure 6. The results (fold over control –WT-) are expressed as the mean ± SEM (n = 4). Statistical significance was analysed by two-way ANOVA with Tukey’s post-hoc test. *p < 0.05 respect to WT.
