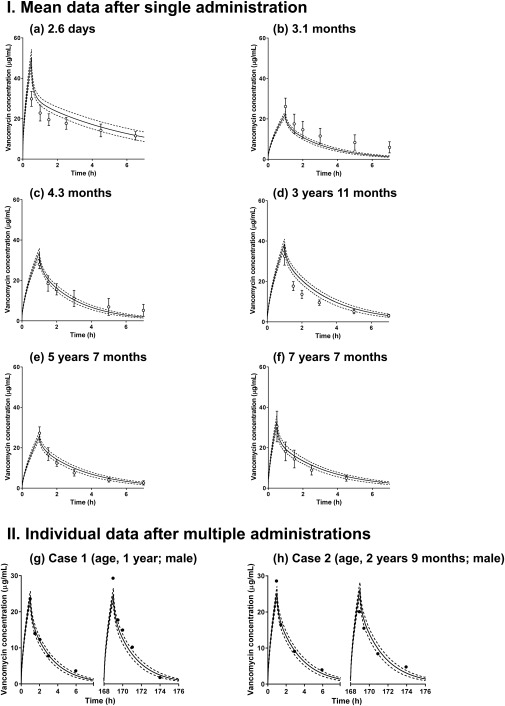
Figure 4.

Observed and simulated system concentration‐time profiles of vancomycin in US and Japanese pediatric patients through physiologically based pharmacokintic (PBPK) modeling. Solid and dashed lines represent the mean and 5th/95th percentiles of the simulation results, respectively. I (a–f) Open circles represent the observed mean data from reported clinical studies.37 Parameter settings used for each simulation in this study are summarized in Supplementary Table S3. II (g and h) Closed circles represent the observed individual data from reported clinical studies.38 Parameter settings used for each simulation are summarized in Supplementary Table S4.
