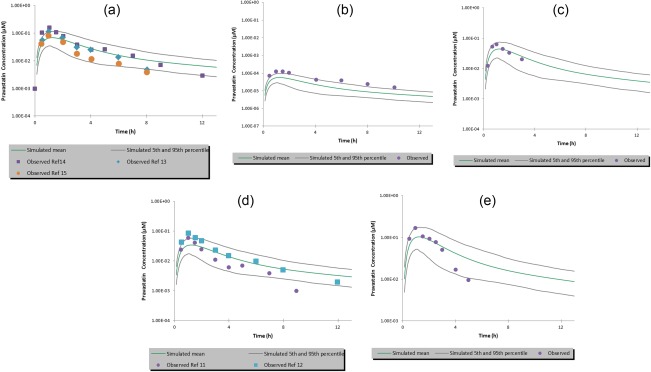
Figure 3.

Simulated vs. observed plasma concentration‐time profiles of pravastatin after a single oral dose of (a) 40 mg; (b) 0.0372 mg; (c) 18.23 mg; (d) 20 mg, and (e) 60 mg. The dots are the observed clinical data. The simulated mean is the mean of 230 individuals (10 trials of 23 subjects per trial); the 5th and 95th percentiles for 230 individuals simulated represents the 5th and 95th highest concentrations from the ranked concentrations. The input parameters used in the simulation are listed in Table 1.
