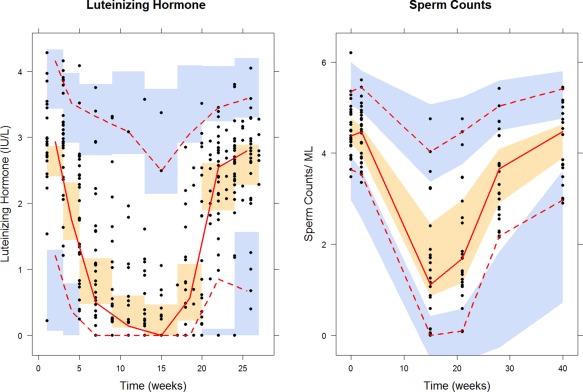
Figure 3.

Visual predictive checks for luteinizing hormone (left) and sperm counts (right) obtained from 1,000 simulations. Black solid points are observed concentrations. Red solid and dashed lines represent 2.5th, 50th, and 97.5th percentiles of observed data. The shaded areas indicate simulation‐based 95% confidence intervals around the median (orange) and the 2.5th and 97.5th percentiles (blue) from 1,000 simulations with the final model.
