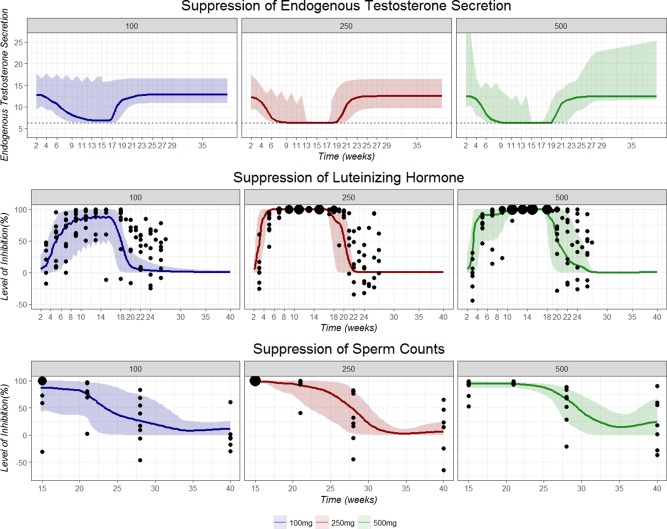
Figure 4.

Summary of level of suppression of endogenous testosterone secretion (top), luteinizing hormone synthesis (LH; middle), and sperm counts (bottom) over time during and after testosterone cypionate dosing based on post hoc parameters from 31 subjects. Colored solid lines represent the median suppression level. Horizontal dashed line represents basal endogenous testosterone secretion independent of LH upregulation. Shaded areas indicate 95% confidence interval of the suppression level. Blue: 100 mg, Red: 250 mg, and Green: 500 mg. Black solid points represent the observed percentage change of variable of interest (LH30 or sperm counts) from baseline. The size of black points represents the frequency of observations.
