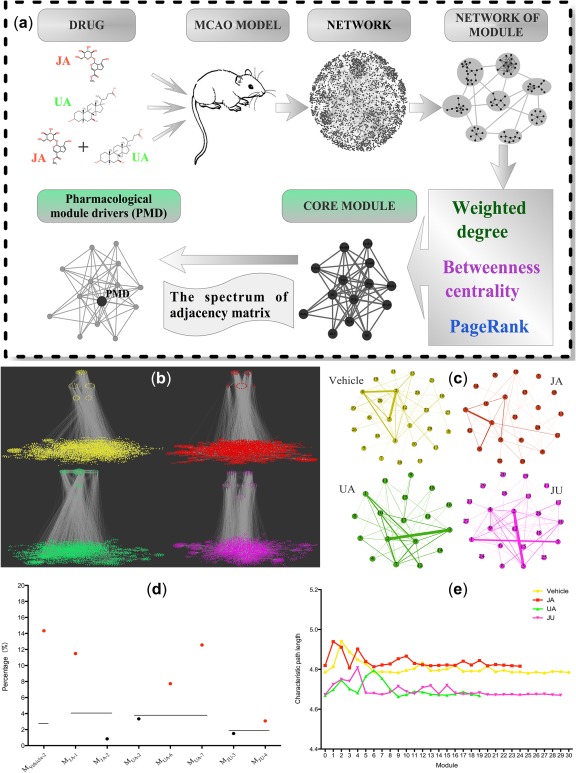
Figure 1.

Schematic diagram of analyzing the synergistic pharmacological mechanism. (a) Workflow of identifying the pharmacological module driver (PMD). (b) Screening and identification of core modules from different ischemia networks. Networks in colors of yellow, red, green, and pink represent the vehicle, jasminoidin (JA), ursodeoxycholic acid (UA), and JU (jasminoidin and ursodeoxycholic acid) groups, respectively. The modules from top to down are the top three ranked modules identified by the three methods. (c) Modular network of each group; the nodes in the network represent modules. (d) The rate change of characteristic path length after removing each top one module identified by the three methods from the modular network. The black line is the average rate change of characteristic path length, and the red and black points represent longer or shorter than the average, respectively. (e) The characteristic path length after removing each module from the network. MCAO, middle cerebral artery occlusion.
